


We may earn a commission through these partner links. Demo funds are virtual; access and country eligibility depend on the platform terms. Disclosure
Heikin Ashi transforms ordinary price data to create a smoothed chart. Its displayed values should not automatically be treated as the quotes available for entry or settlement.
Understand the transformation
A common Heikin Ashi close averages the current ordinary open, high, low and close. Its open uses the prior Heikin Ashi open and close. High and low are constructed from the relevant ordinary and transformed values.
The resulting candles can differ from ordinary OHLC candles. TradingView’s documentation explicitly distinguishes these synthetic chart values from market prices used for execution.
An original numerical example
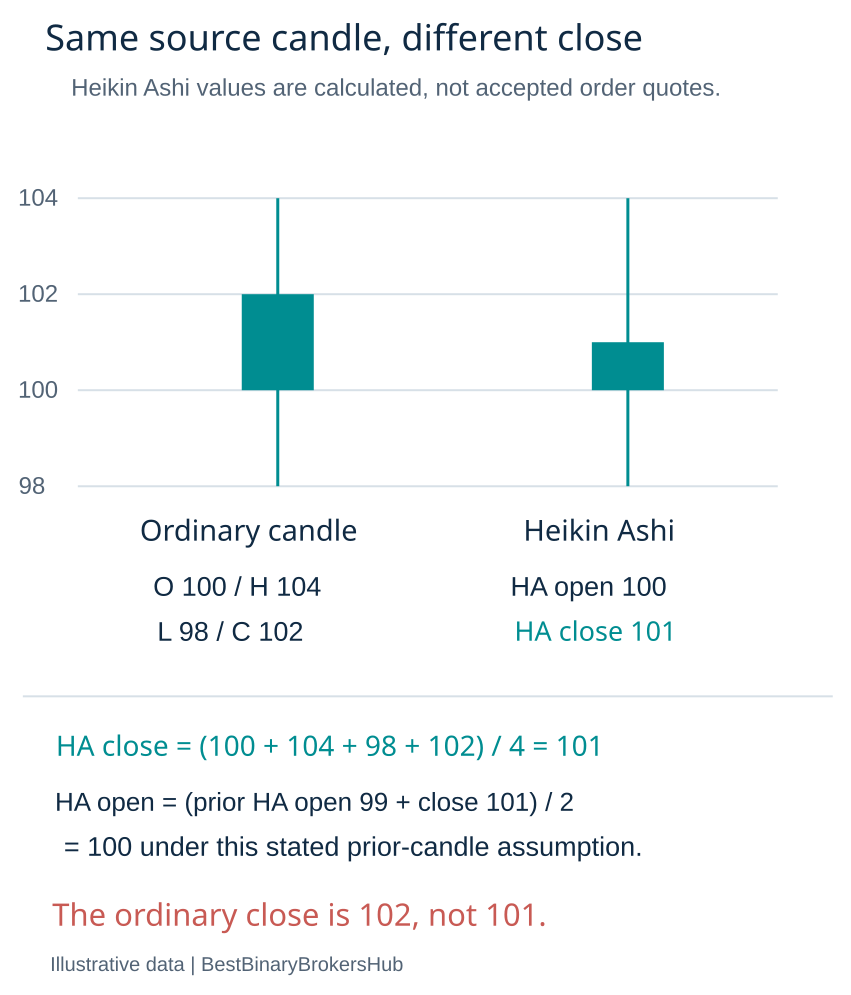
Suppose an ordinary candle opens at 100, reaches 104, falls to 98 and closes at 102. Its Heikin Ashi close under the stated convention is (100 + 104 + 98 + 102) ÷ 4 = 101.
The ordinary close is 102. An assumed entry at the transformed close of 101 would therefore need justification; the transformation does not prove that a market order could enter there.
Compare the data roles
| Value | Use |
|---|---|
| Ordinary OHLC | Summarises the selected underlying feed |
| Heikin Ashi OHLC | Provides transformed visual information |
| Accepted order quote | Records the actual contract entry |
| Settlement quote | Determines the result under the terms |
Why a smoother trend can mislead a test
A transformed chart can show a clean sequence while hiding some ordinary-candle variation. If a backtest both reads signals and assumes fills at transformed prices, the simulated result can be unrealistic.
A defensible experiment separates the signal series from the execution series. State which data generates the condition and which data determines the entry and exit.
Fixed expiry needs the actual reference
A contract may settle against a defined server or market quote rather than the transformed candle. A Heikin Ashi candle colour is not the contractual result.
Preserve the accepted entry and exact expiry. Do not infer a tie or profitable outcome solely from a smoothed chart whose prices differ from the settlement source.
A useful demo comparison
Place ordinary and transformed series side by side with the same underlying instrument and interval. Record where their opens and closes differ and how this affects the interpretation.
The lesson is data identity, not a recommendation that one chart guarantees better results. A clear visual trend still requires honest testing, payoff accounting and acknowledgement of uncertainty.
Calculate a complete transformed candle
Extend the fictional ordinary candle above, with open 100, high 104, low 98 and close 102. Assume the preceding Heikin Ashi open was 99 and its close was 101. The next transformed open is their average, 100; the transformed close is 101.
Under the common construction, the transformed high is the maximum of the ordinary high, transformed open and transformed close: 104. The transformed low is the minimum of the ordinary low, transformed open and transformed close: 98. The source of each input matters; these are not four independently traded quotes.
| Field | Ordinary example | Heikin Ashi example |
|---|---|---|
| Open | 100 | 100, from the stated preceding transformed candle |
| High | 104 | 104 under the maximum rule |
| Low | 98 | 98 under the minimum rule |
| Close | 102 | 101, from the ordinary OHLC average |
These values are illustrative, not a platform screenshot or transaction. Initialisation for the first transformed candle also needs a convention. Retain enough earlier data when comparing implementations instead of treating the first visible bar as a universal starting point.
A transformed colour can differ from the ordinary candle
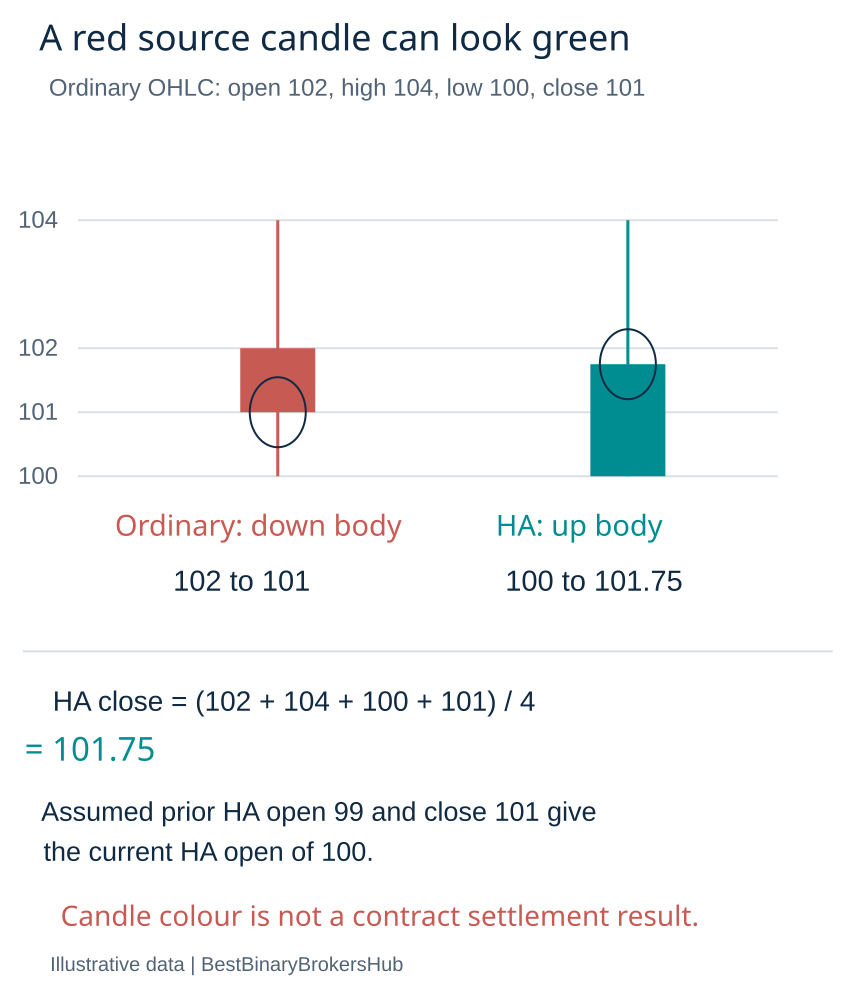
Imagine another fictional ordinary candle opens at 102 and closes at 101, with high 104 and low 100. Its ordinary body points down. Its Heikin Ashi close is 101.75. If its transformed open, calculated from the preceding transformed candle, is 100, its transformed body points up.
There is no contradiction: the two bodies compare different values. Neither colour alone establishes whether a specific contract ended above its accepted entry. Preserve the contract’s actual reference instead of equating a visual colour with a cash result.
Use standard-price fills carefully in a backtest
TradingView’s non-standard-chart guidance warns that fills based on synthetic chart prices can produce unrealistic results. Its support article documents a Heikin Ashi-specific “Using standard OHLC” option for strategy order fills. That setting addresses one simulation issue; it does not automatically validate the entire strategy.
Still check signal timing, costs, order assumptions, data availability and the actual traded product. A standard-chart OHLC simulation is not a measurement of live execution, and it is not automatically the settlement feed of an external fixed-outcome provider.
Keep the signal series separate from the execution series
- Identify the original instrument, data feed, interval and session.
- Record the transformed calculation and relevant warm-up assumptions.
- Define which completed or developing candle generates the condition.
- Use a stated execution-price source and entry timing.
- Apply the actual exit or expiry rule and payoff accounting.
- Retain differences between transformed observations and accepted records.
If the analysis uses a candle’s final high, low and close, those complete inputs were not available at the candle’s opening. Do not use the finished transformed candle to justify a signal at an earlier time without modelling what was known then.
Do not merge two meanings of synthetic
“Synthetic” in this chart context refers to transformed values calculated from another series. It is not, by itself, a statement that the underlying instrument is a proprietary generated index. Heikin Ashi can transform different kinds of source data, so identify the source product separately.
A smooth series also does not prove that ordinary-candle volatility disappeared. The transformation changes representation. It does not remove the price path, contract exposure or operational risks faced by someone transacting at actual quotes.
Frequently asked questions
Is a Heikin Ashi close necessarily an executable price?
No. It is a calculated average under the chart’s construction. An accepted transaction requires its own price record.
Can a green transformed candle coexist with a red ordinary candle?
Yes. Their bodies compare different opens and closes. The worked example illustrates how that can occur.
Does the standard-OHLC option prove a strategy is profitable?
No. It changes an order-fill assumption in the documented simulation. Other methodological and product-specific limitations remain.
Which chart should decide a fixed-expiry result?
The governing contract specifies the relevant source and rule. Use its accepted entry and settlement records; our price-source research hub and chart academy explain those distinctions.
Sources and research scope
- TradingView Heikin Ashi explanation
- TradingView non-standard chart data and execution limits
- TradingView unrealistic backtests on non-standard charts
Public-source review: 25 October 2026. Examples are illustrative. Documentary research does not represent funded-account testing. Rules must be checked against the current product, entity and customer location.
Related research
Chart learning academy · Research methodology · Calculation tools
Risk: Fixed-outcome contracts can lose the entire stake. No chart pattern, calculator or demo result guarantees future returns.