


We may earn a commission through these partner links. Demo funds are virtual; access and country eligibility depend on the platform terms. Disclosure
VWAP needs a defined price series and volume measure. If the meaning of a chart’s volume is unknown, a precise-looking VWAP line can conceal an important data gap.
The calculation needs two inputs
A basic weighted-average calculation sums price multiplied by volume and divides by total volume over the selected period. Implementations may use a representative bar price and a chosen anchor or reset convention.
State the price source, volume field and period. A session VWAP and an anchored calculation beginning at another event need not produce the same value.
An original calculation
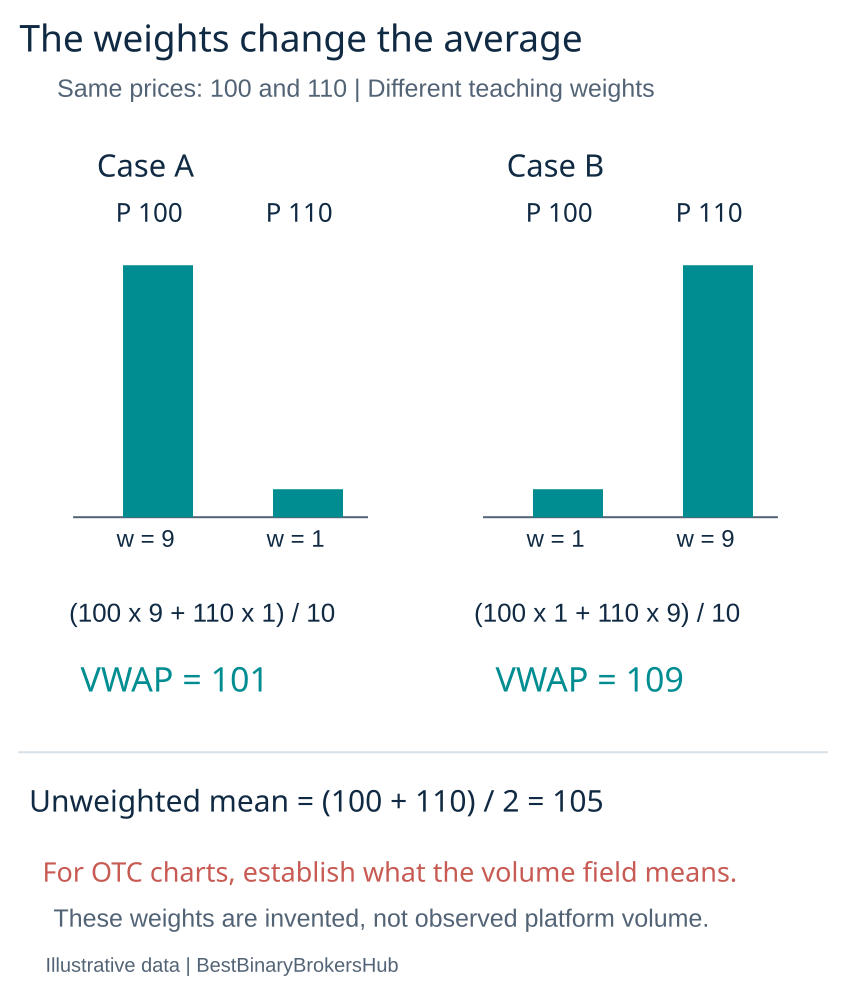
Suppose two observations have prices 100 and 110, with volumes 9 and 1. The weighted average is (100 × 9 + 110 × 1) ÷ 10 = 101. The unweighted mean is 105.
If the volume weights were reversed, the weighted average would be 109. This shows why the meaning and reliability of the weights matter.
Volume can describe different things
An exchange’s traded quantity, a feed’s tick count and a provider-specific activity measure are not automatically equivalent. Do not label one as total market volume without evidence.
For an OTC-labelled series, ask what data the platform supplies and whether its documentation explains the volume field. An unavailable or zero field may prevent a meaningful calculation.
A data-verification checklist
| Input | Question |
|---|---|
| Price | Which feed and bar-price convention? |
| Volume | Traded units, ticks or another measure? |
| Anchor | Where does accumulation begin? |
| Session | Which timezone and reset boundary? |
| Missing values | How are absent observations handled? |
Avoid importing outside weights silently
Applying exchange volume to an unrelated provider-specific price series creates a hybrid measure. That can be an explicitly defined research construction, but should not be presented as the platform’s native market VWAP.
Document the join and time alignment. A same-named asset does not guarantee that every price and volume observation refers to the same market.
A line is not a probability forecast
Price above VWAP describes its relation to that calculated average. It does not establish that an upward contract will win at a selected expiry.
Before testing a rule, verify inputs, freeze the definition and retain all outcomes. If the volume basis remains undocumented, state the limitation rather than recommending a precision setting as a solution.
A cumulative calculation and its reset
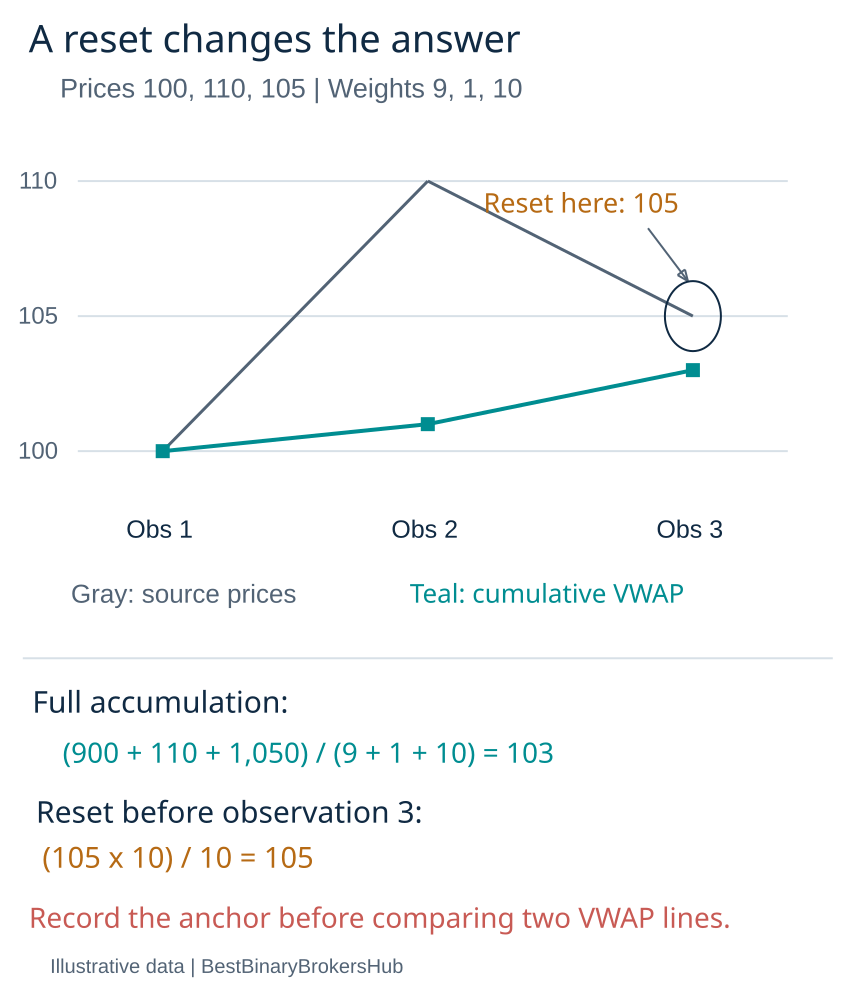
Extend the fictional observations above with a third price of 105 and a weight of 10. The cumulative numerator becomes 900 + 110 + 1,050 = 2,060, and the total weight becomes 20. The weighted average is therefore 103.
If a new session begins immediately before that third observation and the calculation resets there, the new-session value begins at 105 instead. Both results follow their stated definitions. An unexplained difference between two lines may be an anchor difference rather than an arithmetic error.
| Observation | Price | Weight | Cumulative weighted average |
|---|---|---|---|
| First | 100 | 9 | 100 |
| Second | 110 | 1 | 101 |
| Third | 105 | 10 | 103 |
These are teaching weights, not a provider’s observed volume. If the source represents tick activity, label the result accordingly rather than describing it as the volume-weighted average of all transactions across a global market.
Session, anchored and rolling calculations differ
A session-based VWAP restarts at a defined boundary. An anchored VWAP begins at a selected point. A rolling volume-weighted moving average uses a moving window that drops older observations. Similar names do not make these the same statistic.
TradingView documents a user-selected start for its Anchored VWAP drawing tool. Preserve that selection in a study. Moving the anchor after seeing a profitable-looking reversal changes the experiment and can introduce hindsight.
Representative bar prices are approximations with a purpose
A bar-based implementation can weight a representative price, such as the average of high, low and close, by the bar’s volume. A calculation using every individual transaction may use different inputs. Do not claim the two must match exactly without examining the aggregation.
Record the chosen source field and interval. A one-minute and an hourly calculation can differ if their representative prices summarise the underlying observations differently. More displayed decimal places cannot correct missing or mismatched input data.
Missing weights require explicit treatment
If cumulative weight is zero, the basic ratio is undefined. If a row’s weight is missing, substituting one gives that row equal artificial weight; substituting zero excludes it from the numerator and denominator. Neither choice should be silently presented as observed market volume.
Keep a missing-data flag and document the implementation’s behaviour. If the field’s meaning cannot be established for an OTC instrument, the appropriate finding may be that a native volume-based interpretation remains unsupported.
A reproducible data worksheet
- Identify the full instrument, feed and account product.
- Define the price input and what the weight measures.
- Record interval, timezone and session or anchor boundary.
- Preserve original prices and weights before calculating.
- Check zero, missing and duplicate observations.
- Label any cross-source data join and its time alignment.
Only after those checks should a separate decision rule be evaluated. “Price is above this weighted average” is a descriptive statement. It does not establish expected profit, a reliable expiry direction or a provider’s execution quality.
Frequently asked questions
Does a volume bar prove total market trading volume?
No. Establish the source and measure. A feed-specific activity count and exchange-traded quantity are different inputs.
Can I replace missing volume with another venue’s data?
You can define a labelled research construction, but it is not automatically the original platform’s VWAP. Explain the relationship, timestamps and limitations.
Why do two VWAP lines disagree?
Compare source price, weights, anchor, session, interval and missing-data treatment before attributing the difference to error.
Does touching VWAP guarantee a bounce?
No. A calculated average does not create a guaranteed future response. Use our research methodology and OTC data research to distinguish a chart observation from outcome evidence.
Sources and research scope
- TradingView VWAP definition and settings
- TradingView volume documentation
- TradingView: Anchored VWAP start point
Public-source review: 25 October 2026. Examples are illustrative. Documentary research does not represent funded-account testing. Rules must be checked against the current product, entity and customer location.
Related research
OTC data research · Research methodology · Calculation tools
Risk: Fixed-outcome contracts can lose the entire stake. No chart pattern, calculator or demo result guarantees future returns.