


We may earn a commission through these partner links. Demo funds are virtual; access and country eligibility depend on the platform terms. Disclosure
Opening several contracts does not necessarily diversify the underlying risk. Positions can react to the same price movement, session event or provider-specific data process.
Count total exposure first
If three simultaneous contracts each risk two units from a 100-unit balance, six units are exposed before considering refunds or other product features. Looking only at each contract’s 2% fraction hides the combined 6% stake.
This total is an accounting fact under the stated full-stake-loss assumption. The probability of losing all six units needs a model of how the outcomes relate.
Compare independent and perfectly linked examples
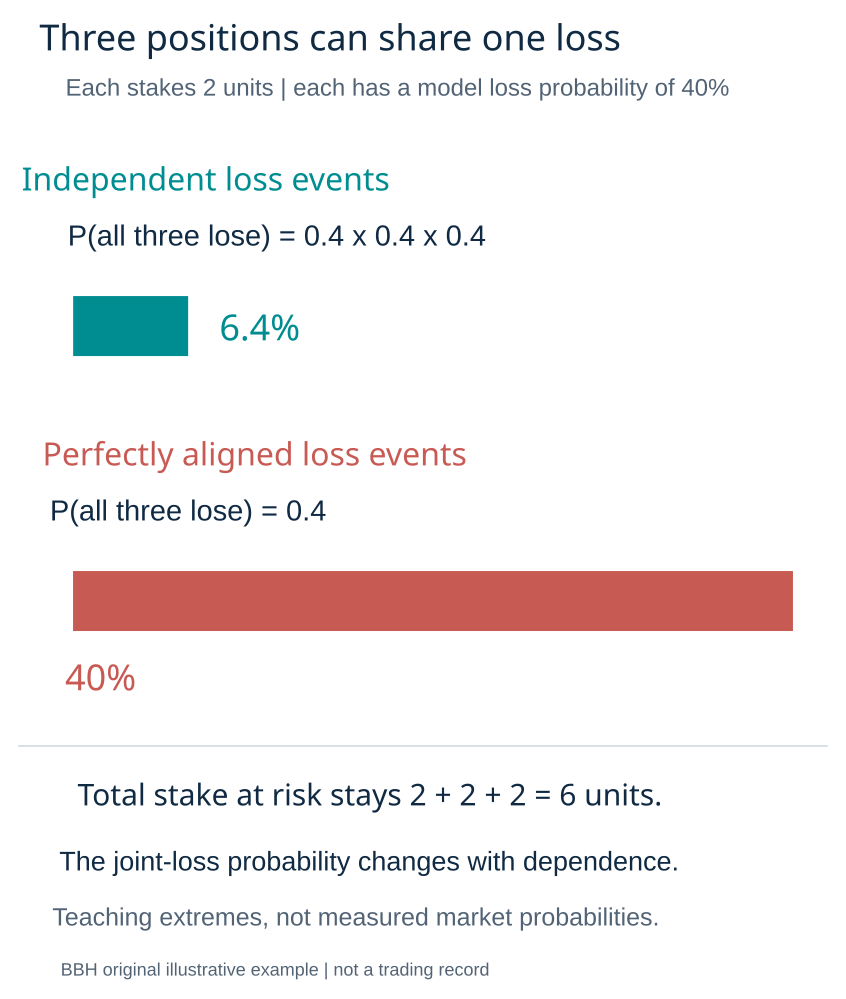
Assume, purely for illustration, each contract has a 40% loss probability. If all three losses are independent, the probability of three losses together is 0.4 cubed, or 6.4%.
If their loss events are perfectly aligned, all three lose together with probability 40%. The individual probabilities are unchanged, but the joint exposure is very different.
Shared labels do not reveal the whole dependence
Currency pairs can share a currency, multiple contracts can reference the same asset and repeated entries can overlap in time. A provider-specific source can create another shared element.
Do not infer exact numerical correlation merely from those relationships. Record the common drivers and investigate the actual data.
An exposure worksheet
| Field | Reason |
|---|---|
| Instrument | Identifies shared references |
| Direction | Shows potentially aligned outcomes |
| Entry and expiry | Reveals overlapping windows |
| Stake | Calculates combined amount at risk |
| Price source | Identifies shared data dependence |
Diversification cannot be assumed from trade count
Ten entries generated by one signal at nearly the same time may contain less independent information than ten widely separated observations. A high count can exaggerate both diversification and confidence in a measured win rate.
Keep grouped events visible when analysing the journal. Do not treat every row as an independent experiment without justification.
Use scenario analysis rather than a safe-number claim
Calculate what happens if all open stakes lose together, if only a subset settles adversely and if platform access is interrupted. These scenarios describe exposure, not exact probabilities unless a supported model is supplied.
No universal number of concurrent contracts is safe for every reader. Reducing stake size or trade count does not by itself establish favourable expected value or remove provider risk.
Separate total stake from joint-loss probability
The earlier three-contract example risks six units in total under the stated full-loss assumption. That total does not require a correlation estimate. The probability of losing the full six units does require assumptions about the joint outcomes.
| Illustrative model | Each contract’s loss probability | All three lose |
|---|---|---|
| Independent loss events | 40% | 6.4% |
| Perfectly aligned loss events | 40% | 40% |
These are limiting teaching scenarios, not estimates for actual instruments. Knowing the three individual loss rates does not establish which joint model applies. A shared currency or similar chart shape is a reason to investigate dependence, not a numeric correlation measurement.
A joint outcome ledger makes the difference visible
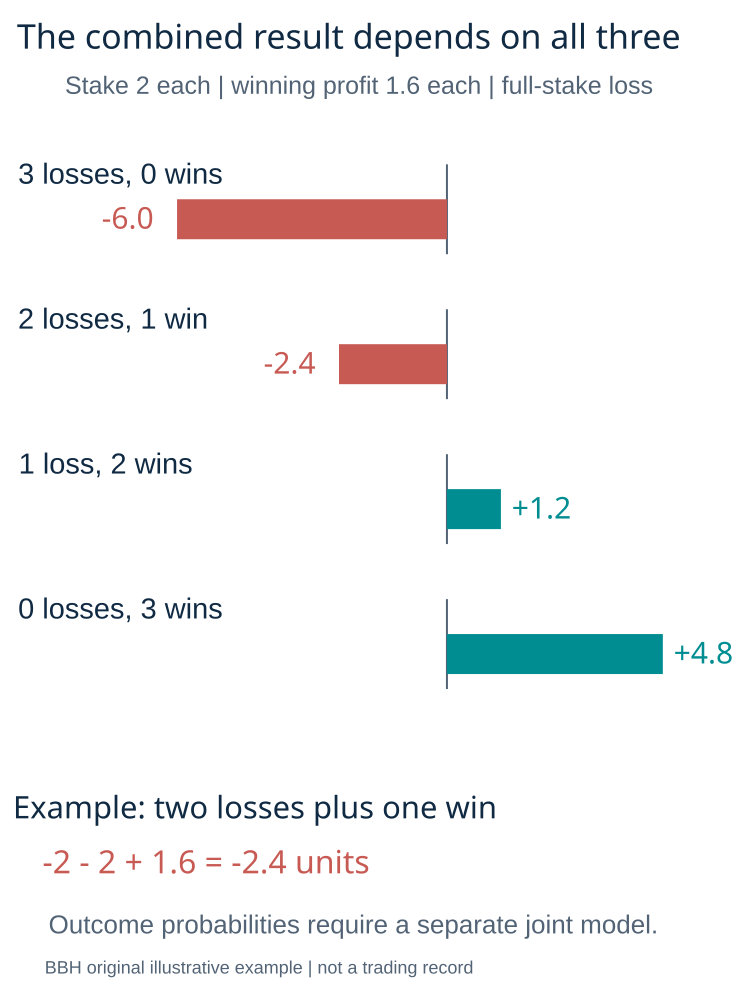
Assume each fictional contract stakes two units and a win earns 1.6 units net. If all three lose, the combined result is minus six. If two lose and one wins, the result is minus 2.4. If one loses and two win, it is plus 1.2. Three wins give plus 4.8.
Under either of the table’s models, each contract’s expected net result is 0.6 × 1.6 − 0.4 × 2 = 0.16 units, making the combined expectation 0.48. Dependence changes the distribution of joint outcomes even when those marginal expectations remain the same. This arithmetic does not show that any real rule has those favourable inputs.
Price correlation is not the same as contract-outcome dependence
A correlation calculated from instrument returns describes a particular dataset, interval and statistic. A fixed-expiry contract also depends on entry, direction, expiry and payoff conditions. Similar price movements do not guarantee identical contract results.
Likewise, opposite directions do not automatically create a costless hedge. Different entries, expiry times, spreads, payout asymmetry and settlement sources can leave both positions with unfavourable results. Establish the actual joint payoff rather than inferring protection from arrow labels.
Group observations by shared drivers
- Record all contracts open during the same time window.
- Identify common underlying instruments, currencies or event exposures.
- Keep direction, accepted entry and expiry beside each stake.
- Record price-source and provider dependencies separately.
- Assign a group identifier to entries generated by one signal or move.
- Review both individual outcomes and the combined result for each group.
FINRA’s concentration-risk guidance explains why having several holdings need not eliminate exposure to a common risk. Investor.gov similarly describes diversification across investments. These general principles are not evidence that a particular set of short-expiry contracts is diversified.
Several accounts can still share operational exposure
Contracts across different symbols may use the same platform, legal entity or funding route. Those relationships can create operational concentration even if their prices are not closely related. A data outage, account restriction or provider problem is a different scenario from a shared market move.
Keep operational and market scenarios separate in the worksheet. Do not combine them into one unsupported probability. A successful payment or separate login does not itself establish legal or financial independence between providers.
Trade count can exaggerate statistical information
Ten nearly simultaneous entries from one event should not automatically be treated as ten independent tests of a prediction method. Preserve the group structure when describing sample size and uncertainty. A confidence interval based on an unsuitable independence assumption can look narrower than the evidence warrants.
Historical dependence can also change across conditions. State the observation period, data basis and uncertainty if reporting a measured correlation. Do not present a past estimate as a permanent relationship or use it as a universal safe-stake rule.
Frequently asked questions
Do several small stakes automatically diversify risk?
No. Add the exposure first, then investigate shared drivers and joint outcomes.
Can identical individual win rates produce different risk?
Yes. The independent and perfectly aligned examples have the same individual rates but different chances of simultaneous losses.
Does a negative correlation guarantee no combined loss?
No. Check the actual contract payoff, timing and source. A statistical relationship does not make every joint outcome protective.
What should a research summary report?
State total exposure, overlapping windows, shared drivers and the assumptions behind any probability. Our exposure tools and research methodology help keep scenarios distinct from measured estimates.
Sources and research scope
- BBH research and assumption disclosure methodology
- FINRA: concentration risk
- Investor.gov: asset allocation and diversification
Public-source review: 25 October 2026. Examples are illustrative. Documentary research does not represent funded-account testing. Rules must be checked against the current product, entity and customer location.
Related research
Exposure calculation tools · Research methodology · Calculation tools
Risk: Fixed-outcome contracts can lose the entire stake. No chart pattern, calculator or demo result guarantees future returns.