


We may earn a commission through these partner links. Demo funds are virtual; access and country eligibility depend on the platform terms. Disclosure
A leaderboard of current winners may exclude failed, closed or reset accounts. Evaluating only the survivors can make a process appear stronger than the complete population.
Define the population before the ranking
Ask which accounts were eligible at the start, which entered later and which disappeared. A table of accounts still active today answers a different question from the outcome of everyone who began the experiment.
Changing eligibility can distort comparisons even when every visible number is correctly calculated.
An original thought experiment
One hundred independent fair signal generators each produce five outcomes. The expected number with five wins is 3.125, because each has probability 1/32 of a perfect five-outcome record.
If a website displays only those perfect survivors, the visible group appears to have 100% accuracy. That presentation hides the original hundred and the selection process. The arithmetic does not imply those survivors have a better next-outcome probability.
Look for hidden resets
A losing account can disappear while a new account begins at a fresh balance. If the same operator keeps only the successful identity visible, the published history is not the operator’s complete result.
Ask for original start dates, cash flows, account changes and archived records. A recent clean chart should not silently replace an earlier failed experiment.
A leaderboard audit checklist
| Question | Why it matters |
|---|---|
| Who started? | Defines the denominator |
| Who was removed? | Reveals attrition |
| Were accounts reset? | Identifies erased history |
| Did stakes change? | Explains return and risk differences |
| Are full losses retained? | Tests the completeness of results |
Separate survivor bias from other biases
Selecting the best configuration from many tests is an optimisation problem. Removing failed accounts is a population-selection problem. Deleting losing trades is a reporting problem.
Several can occur together, but describing them precisely makes the evidence request clearer. Do not use a broad bias label as a substitute for identifying which records are missing.
Report a cohort, not just the winners
Where data permits, follow a defined starting group through the full period and retain closed accounts. Report missing records and explain any exclusions.
A current winner can still be worth studying, but its rank is not proof of a stable edge or suitable exposure. Performance should be assessed alongside the full denominator, drawdown, payoff and independent evaluation, without promises about future results.
Worked cohort example: winners are not the starting population
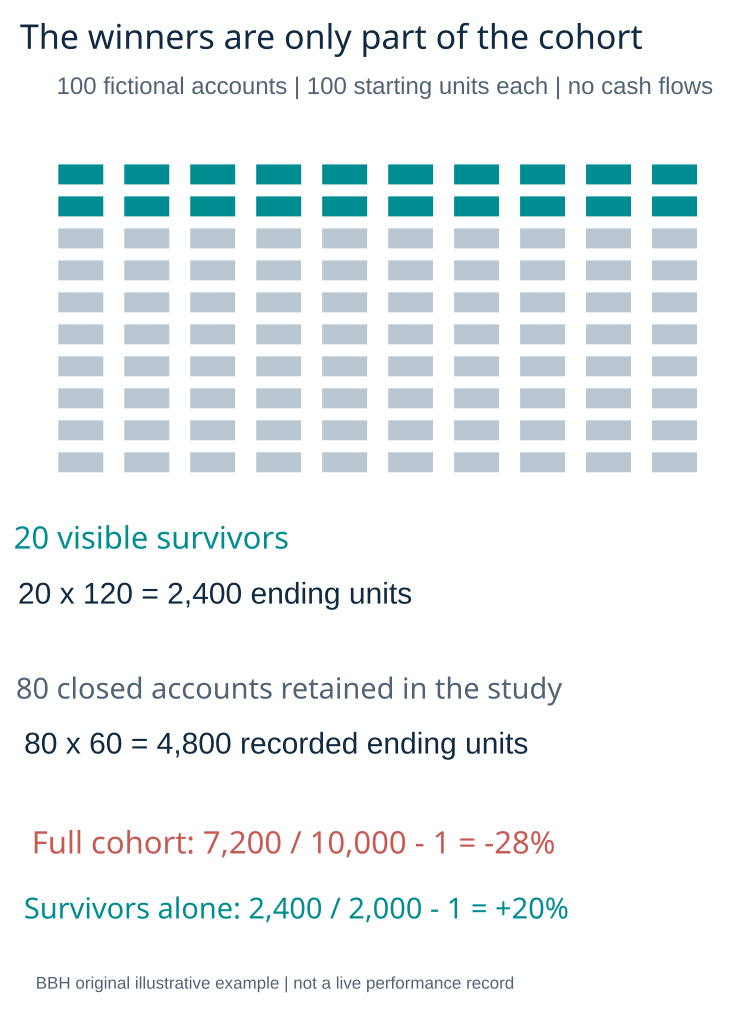
Suppose 100 hypothetical accounts each begin with 100 units and have no later deposits or withdrawals. At the observation date, 20 accounts remain visible with 120 units each. The other 80 are closed with a recorded final value of 60 units each, measured consistently at closure and retained in the study. The visible survivors show a 20% gain, but they are only one fifth of the original cohort.
| Group | Accounts | Starting total | Recorded ending total |
|---|---|---|---|
| Visible survivors | 20 | 2,000 units | 2,400 units |
| Closed accounts | 80 | 8,000 units | 4,800 units |
| Entire starting cohort | 100 | 10,000 units | 7,200 units |
The full-cohort loss is 2,800 units, or 28% of starting capital. The survivor-only gain is mathematically correct for that selected group, yet it answers a different question. This invented example assumes known final records for closed accounts. Real missing records cannot simply be assigned the same loss or a zero balance.
Use a cohort ledger with explicit entry and exit rules
Choose the observation population before evaluating outcomes. Record original account identifiers, start dates, eligibility rules, end dates, closure reasons and any identity changes supported by evidence. Keep later entrants in a separately labelled cohort rather than comparing their shorter histories as if they shared the same full period.
- Save the initial eligible-account list and selection criteria.
- Record periodic observations without replacing earlier snapshots.
- Track removals, closures, resets and missing observations separately.
- Reconcile cash flows and performance using a consistent method.
- Publish both the starting denominator and the number with complete outcomes.
A vanished profile does not prove failure: an account could close for another reason or become private. Conversely, absence of a failure label does not justify deleting it from the denominator. Describe what is known and ask for the missing outcome. Avoid attributing multiple accounts to one operator without evidence.
Missing outcomes limit the conclusion
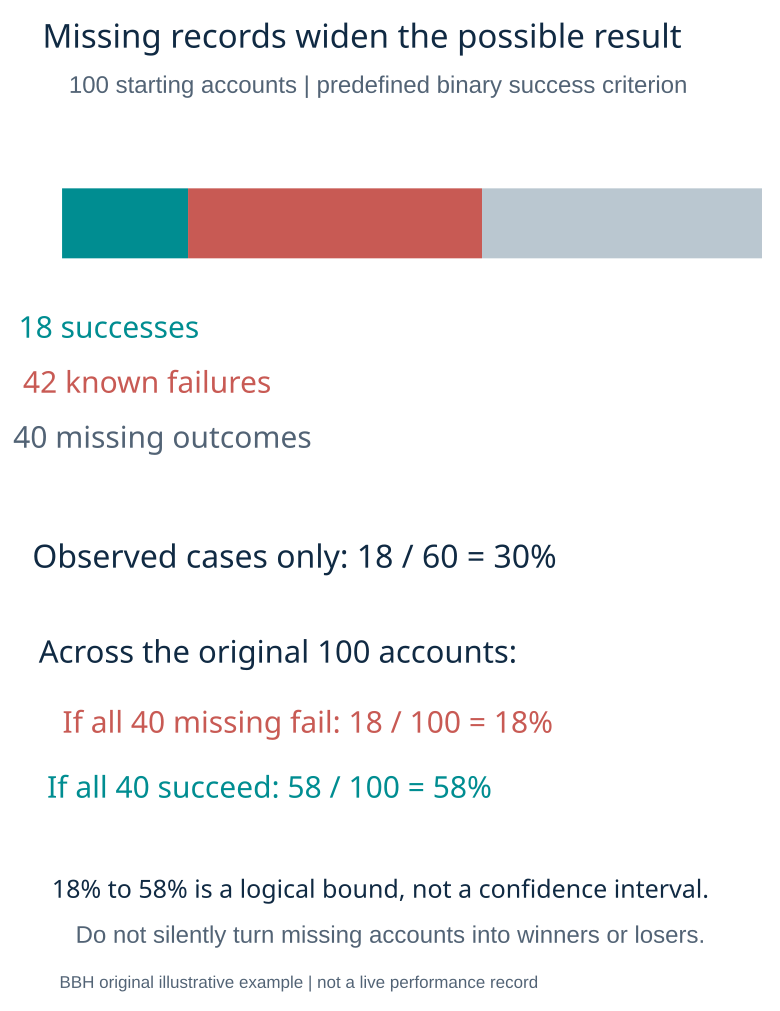
If 60 of 100 starting accounts have known outcomes and 40 are missing, a success rate based on the 60 complete cases is conditional on being observed. Suppose 18 of those 60 meet a predefined success rule: that is 30% among observed accounts. Across all 100 starters, the success fraction could range from 18% to 58% depending on the 40 unknown outcomes. These are logical bounds, not estimates of the missing accounts’ performance.
Report that uncertainty instead of treating unknowns as winners or losers. Sensitivity analysis can state alternative assumptions, but those assumptions should remain visible. A leaderboard that does not expose its original membership may support only a description of the current table.
A primary-source example from fund measurement
S&P Dow Jones Indices explains that its SPIVA comparisons include the starting opportunity set, including funds that merge or liquidate during the period, to address survivorship bias. That fund methodology illustrates why disappeared members matter. It does not provide evidence about a particular trading leaderboard or establish that fund results transfer to fixed-outcome contracts.
For leaderboards, also ask whether ranking measures gross return, net return, profit in currency units or a percentage adjusted for cash flows. A deposit can raise balance without being a trading gain. A high percentage from a tiny account is also different from a large profit amount. Retain both the metric definition and the underlying records.
Use the performance research hub and calculation tools to document denominators, cash flows and assumptions consistently.
Trading leaderboard survivorship FAQs
Is every leaderboard misleading?
No. Its usefulness depends on its stated purpose, eligibility rules, complete records and disclosures. Identify the actual omission before drawing a conclusion.
Does including closed accounts prove future skill?
No. A complete cohort reduces one reporting problem. Predictive skill, costs, drawdown and future performance remain separate questions.
What if the platform will not supply archived outcomes?
State the limitation. Do not turn current survivors into a claim about every participant or reconstruct missing losses from guesses.
Sources and research scope
- Bailey and co-authors: selection and backtest overfitting research
- S&P Dow Jones Indices: SPIVA methodology and survivorship correction
Public-source review: 25 October 2026. Examples are illustrative. Documentary research does not represent funded-account testing. Rules must be checked against the current product, entity and customer location.
Related research
Performance research methods · Research methodology · Calculation tools
Risk: Fixed-outcome contracts can lose the entire stake. No chart pattern, calculator or demo result guarantees future returns.