


We may earn a commission through these partner links. Demo funds are virtual; access and country eligibility depend on the platform terms. Disclosure
Average True Range measures a form of historical price movement. A high ATR does not tell you that the next contract will rise, and a low reading does not guarantee a quiet next interval.
Start with True Range
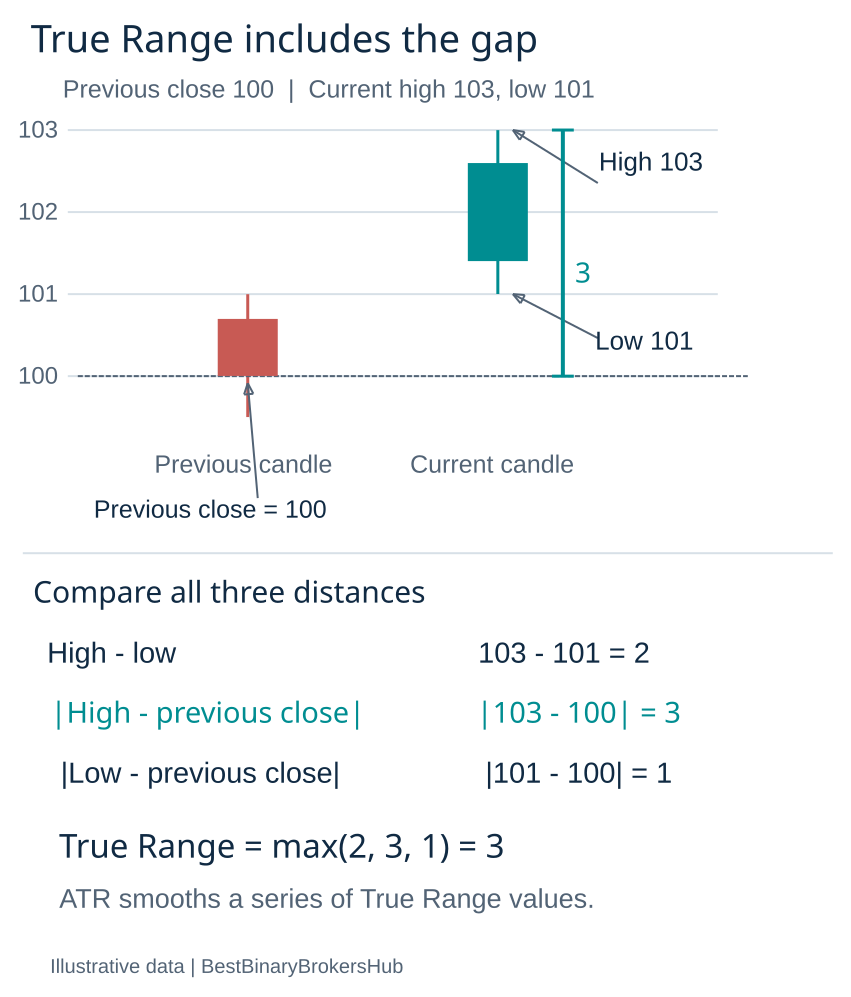
True Range is the largest of high minus low, the absolute difference between high and previous close, and the absolute difference between low and previous close. ATR smooths that series over a chosen length.
TradingView documents RMA as its default smoothing while allowing alternatives. Match the implementation before comparing values from different charts.
An original calculation
Suppose the previous close is 100, current high is 103 and current low is 101. The three candidate ranges are 2, 3 and 1, so True Range is 3.
Using only high minus low would give 2 and miss the gap relative to the previous close. This example explains the formula; it is not evidence about a particular market’s next movement.
Know the units
ATR is normally expressed in the instrument’s price units. A value of 2 on a price near 100 is not directly comparable with a value of 2 on a price near 10,000.
An illustrative normalisation divides ATR by a stated reference price and multiplies by 100. State the reference and convention rather than mixing raw ATR and percentage ATR in one ranking.
Settings to keep fixed
| Setting | Research consequence |
|---|---|
| Instrument and feed | Changes highs, lows and gaps |
| Interval | Changes what one observation represents |
| Length | Changes the historical window |
| Smoothing | Changes response to recent ranges |
| Bar state | Live high and low can still change |
Avoid a fixed-expiry shortcut
A larger historical range does not establish which side of an entry will be reached at expiry. Volatility and direction are different variables.
If studying a rule conditional on ATR, choose the threshold before the evaluation sample. Retain all qualifying observations and use their actual payout assumptions. Selecting only the successful volatile periods overstates the evidence.
Use the number for description first
A demo exercise can compare how the same formula changes across sessions while preserving instrument and settings. Record missing data and session gaps explicitly.
ATR does not certify data quality, provider fairness or a safe stake. Treat it as one descriptive input and keep contract mechanics and financial exposure separate.
From True Range to an ATR value
True Range is one observation; ATR is a smoothed sequence. Do not label the current candle’s high-low difference as ATR unless the chosen calculation actually produces that value. Match the lookback, smoothing and initialisation when comparing two implementations.
For a fictional three-period Wilder-style smoothing exercise, suppose the preceding ATR is 2 and the new True Range is 5. The recursive update is (2 × 2 + 5) ÷ 3 = 3. This demonstrates the calculation after an initial value exists. It is not a claim about any market’s current reading or the universal starting convention used by every platform.
Normalise only with a stated denominator
| Illustrative instrument | ATR | Reference price | ATR divided by reference |
|---|---|---|---|
| A | 2 | 100 | 2% |
| B | 2 | 10,000 | 0.02% |
The raw ATR values match, but the relative magnitudes do not. TradingView’s separate ATR% explanation uses ATR divided by close times 100. If another worksheet uses a different reference, document it. Do not compare a raw price-unit value with a percentage as though they have the same units.
Why equal ATR does not mean equal paths
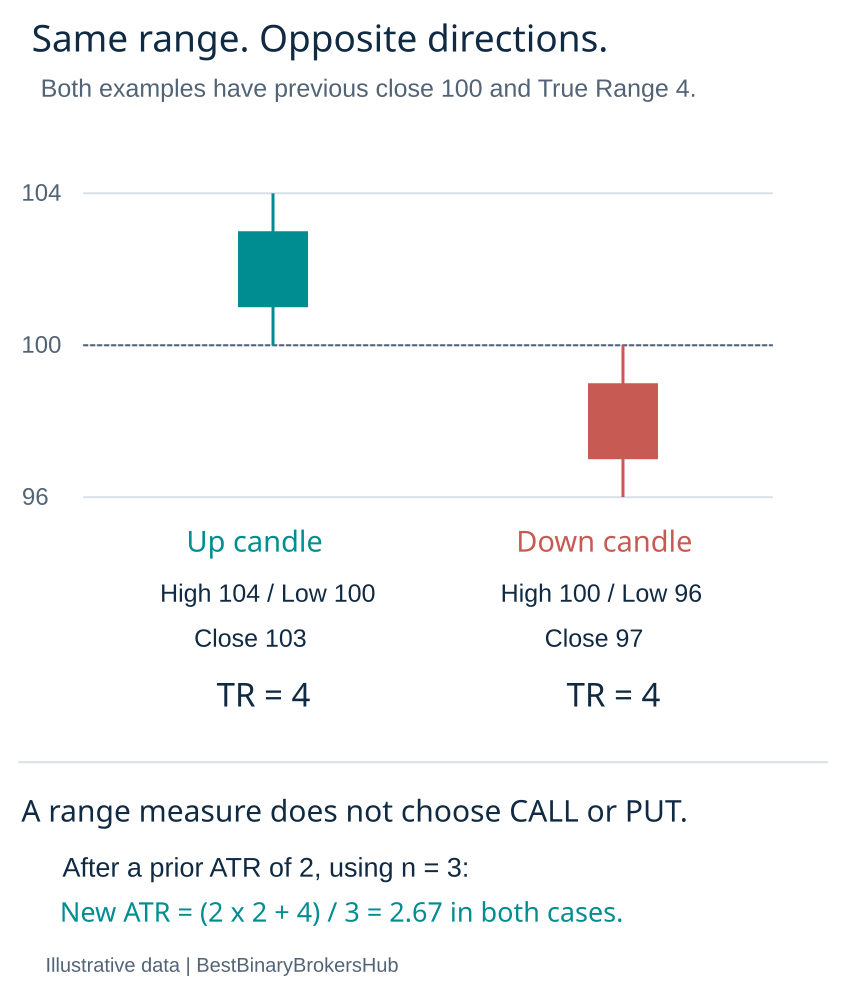
Imagine two fictional sequences with similar range statistics. One alternates upward and downward movements; the other moves more consistently in one direction. A measure of range magnitude alone does not identify which sequence will end above a particular entry price.
Similarly, an ATR of 2 is not a promise that the next bar will move exactly 2 units. It does not set a hard ceiling on a gap or provide a calibrated probability that a price level will be reached. The actual future path and the contract’s expiry remain separate questions.
Completed bars and changing readings
While a candle is open, its high and low can change. An ATR value observed during that candle can therefore differ from the final value later shown in history. Record whether an experiment used the live value or the preceding completed bar.
A daily ATR displayed on an intraday chart introduces another time basis. Identify which daily observation was available at the decision time rather than inserting the day’s final value into an earlier decision. A historical display can be useful without reconstructing everything that was visible live.
A reproducible demo worksheet
- Record the full symbol, data feed and chart interval.
- Write down length, smoothing and source settings.
- Choose the bar state used for the observation.
- Retain the ATR value and its price units.
- If studying a threshold, define it before the evaluation sample.
- Record all qualifying events, accepted entry timing and actual payoff assumptions.
The worksheet can describe a volatility condition without becoming a trade recommendation. Do not increase a stake because a high reading is presented as higher confidence. ATR is not a probability of a winning direction.
Keep model changes visible
If a study tries several lengths and selects the one that performed best on the same history, retain that selection process. Test the selected version on separate observations before describing it as independently evaluated. Changing the feed, session filter or instrument can also change the sample.
For a fixed-outcome contract, eventual movement is not enough: the relevant result is the specified outcome at expiry under the accepted payoff. An ATR-conditioned rule still needs complete net-result accounting. Our research methodology explains the distinction between a descriptive example and performance evidence.
Frequently asked questions
Is ATR a direction indicator?
No. It describes historical range magnitude. A rise in ATR is not by itself a CALL or PUT instruction.
Does a low value guarantee the next candle is small?
No. A historical summary cannot guarantee the next observation or rule out a sudden gap.
Why do two charts disagree?
Compare instrument, feed, session, interval, length, smoothing, warm-up and bar state. A difference needs investigation rather than an automatic error or manipulation claim.
Can ATR verify a provider’s prices?
No. It is calculated from supplied data. Price-source and settlement checks belong in a separate review through our price-source research hub.
Sources and research scope
Public-source review: 25 October 2026. Examples are illustrative. Documentary research does not represent funded-account testing. Rules must be checked against the current product, entity and customer location.
Related research
Indicator academy · Research methodology · Calculation tools
Risk: Fixed-outcome contracts can lose the entire stake. No chart pattern, calculator or demo result guarantees future returns.