


We may earn a commission through these partner links. Demo funds are virtual; access and country eligibility depend on the platform terms. Disclosure
Simple and exponential moving averages smooth prices differently. A more responsive line can change signals sooner while also reacting more to short-term noise.
The simple average
An n-period SMA is the arithmetic mean of the selected n prices. Every price in that window receives the same weight, and the oldest value leaves when a new one enters.
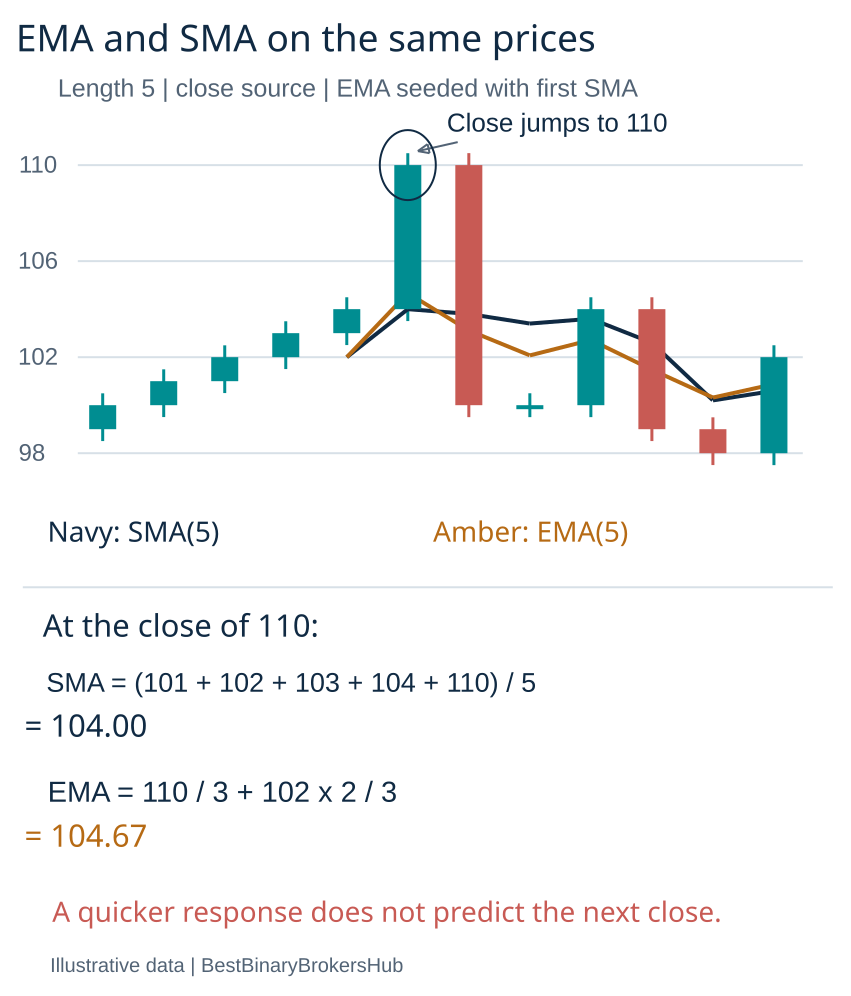
For five illustrative closes of 100, 101, 102, 103 and 104, the SMA is 102. If the next close is 110, the new five-value average becomes 104.
The exponential update
A common EMA update is alpha × current price + (1 − alpha) × previous EMA, with alpha = 2 ÷ (n + 1). Initialisation conventions can affect early values.
For an illustrative five-period EMA, alpha is one third. If the previous EMA is 102 and the new price is 110, the updated value is approximately 104.667. This example uses a stated previous value rather than claiming one universal starting calculation.
What to match in a comparison
| Field | Reason |
|---|---|
| Source price | Close differs from other price averages |
| Length | Defines weighting or window |
| Initialisation | Affects early EMA values |
| Interval | Defines the time represented by a period |
| Feed | Changes the underlying observations |
A crossover describes averages, not a future contract
When a shorter average crosses a longer one, their ordering changes under those settings. That mathematical event does not establish the direction at a particular future expiry.
A historical study must enter after the signal becomes available. Using an earlier candle open because it produces a better result introduces information that was not available then.
Why faster can add false changes
A responsive average may react sooner to a genuine trend and also change direction more often in a range. The balance depends on the dataset and rule.
Do not optimise length repeatedly on one period and present the best version as universally superior. Keep a record of tested variants and evaluate the selected rule separately.
Use the tool descriptively
A demo exercise can calculate both series on the same data and observe where they differ. Include unsuccessful crossings and explain the settings.
Neither smoothing method makes a product safe or creates a favourable expected return by itself. Compare net outcomes with actual payout and cost assumptions before making any performance claim.
Compare the weighting rather than the line colour
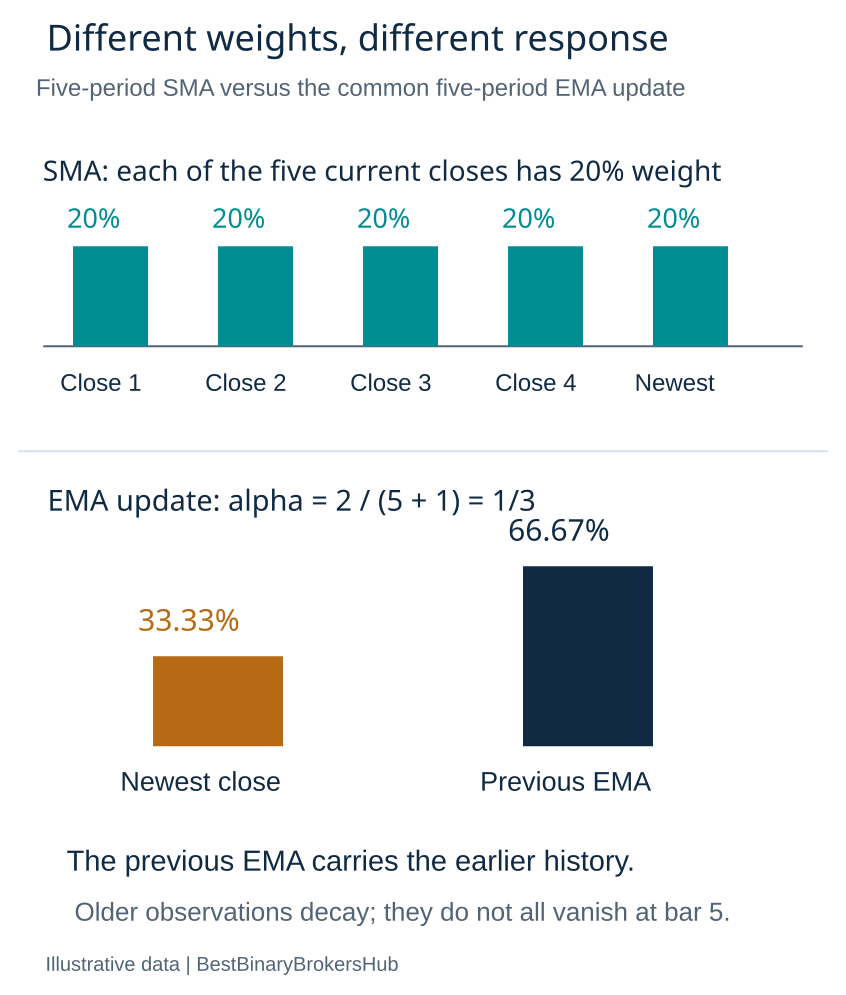
In a five-value SMA, each observation contributes one fifth of the current window. Under the common five-period EMA convention used above, the new observation contributes one third to the next update. The previous EMA carries the remaining two thirds and summarises earlier history.
The EMA’s length does not mean that every older observation disappears after exactly five bars. Its recursive weighting differs from the SMA’s finite window. Comparing only the two length labels hides that difference.
| Feature | SMA | EMA under the stated convention |
|---|---|---|
| Current weighting | Equal across the selected window | More weight on recent observations |
| Old observations | Leave the window explicitly | Influence decays through the recursion |
| Starting values | Require the defined window | Depend on the chosen initialisation |
| Research requirement | Match source and complete observations | Also check seed and warm-up treatment |
Extend the worked example by one more bar
After the fictional close of 110, suppose the next close is 100. The five closes used for the next SMA are 102, 103, 104, 110 and 100, giving 103.8. Using the previous example’s EMA of approximately 104.667, the next update is one third times 100 plus two thirds times 104.667, approximately 103.111.
The relative positions have changed because the methods weight the sequence differently. These invented values illustrate arithmetic, not a performance comparison or evidence that one setting predicts the next bar better.
Define the crossover at the decision time
A completed-bar upward crossing can be defined as the shorter average being at or below the longer one on the preceding bar and above it on the current completed bar. That differs from simply being above, which can remain true for many bars. State how equality is handled and whether only one event is recorded per crossing.
During an open candle, the latest source price can change and move the averages back across each other. A historical closing-bar chart does not preserve every temporary crossing. Keep the live observation if your rule acts before close, or evaluate a completed-bar rule consistently.
Offsets and timeframes can change the apparent story
A visual plot offset can shift where a line is drawn without making the underlying calculation predictive. Do not interpret a line displaced to an earlier bar as information that was available on that earlier bar. TradingView’s SMA settings document the offset separately from the source and length.
A ten-period average on a one-minute chart also does not answer the same question as a ten-period average on an hourly chart. When using a higher-timeframe average, record whether that source bar was complete at the observation time. A later final value should not be silently inserted into an earlier decision.
A fair comparison worksheet
- Use the same original data, source price and session definition.
- Record calculation length, seed and warm-up assumptions.
- Define one observable event and an entry after the information becomes available.
- Keep the same exit or expiry and exposure rules for the comparison.
- Retain all qualifying outcomes and costs or accepted payouts.
- Evaluate the selected configuration on separate observations.
Counting the number of attractive historical crossings is not enough. More signals may mean more exposure, and a higher win rate can coexist with a worse net result under different payoffs. Keep the outcome ledger separate from the descriptive chart.
Frequently asked questions
Is an EMA always better because it reacts faster?
No. Responsiveness is a calculation characteristic. It can also produce more changes around a noisy range. Superiority requires a defined objective and fair evaluation.
Does a crossover guarantee the next candle’s direction?
No. It records the ordering of two averages under specified inputs. It does not establish a fixed-expiry outcome.
Why do two EMAs with the same length differ?
Check source, feed, interval, session, seed, warm-up and bar state. The matching length alone does not establish identical calculations.
Can a shifted line justify an earlier entry?
No. Preserve when the calculation became observable. Our research methodology and indicator academy explain the distinction between plot position and decision-time evidence.
Sources and research scope
- TradingView moving-average definitions
- TradingView EMA calculation
- TradingView SMA inputs and plot offset
Public-source review: 25 October 2026. Examples are illustrative. Documentary research does not represent funded-account testing. Rules must be checked against the current product, entity and customer location.
Related research
Indicator academy · Research methodology · Calculation tools
Risk: Fixed-outcome contracts can lose the entire stake. No chart pattern, calculator or demo result guarantees future returns.