


We may earn a commission through these partner links. Demo funds are virtual; access and country eligibility depend on the platform terms. Disclosure
The probability of six specified consecutive losses is different from the probability of encountering a six-loss run somewhere in a long session. Confusing the two can badly understate risk.
State the model before using the formula
Assume independent observations with a stable loss probability q. The probability that a particular next block of k observations all loses is q raised to k.
Independence and a known stable probability are modelling assumptions. They should not be claimed as established properties of an actual broker or trading rule without evidence.
An original six-loss calculation
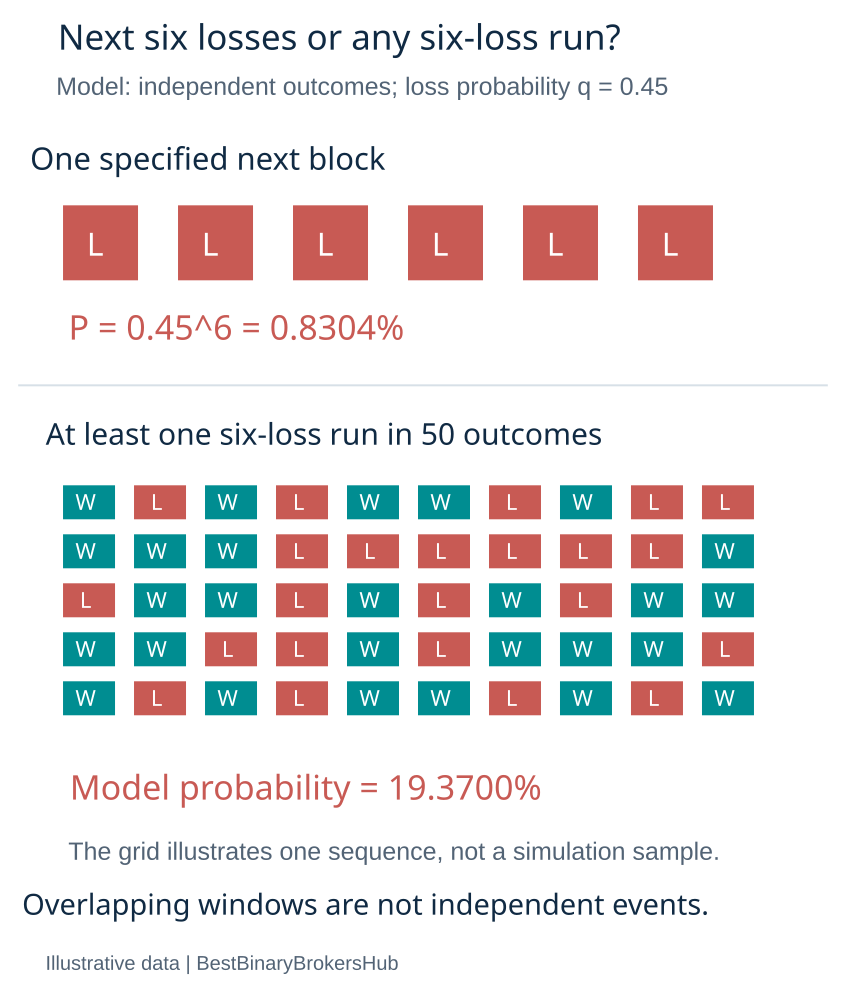
If q is 0.45, the probability that the next six specified observations all lose is 0.45 to the power 6, or approximately 0.8304%.
That is not the probability of seeing such a run anywhere in fifty observations. A longer sequence contains many possible starting positions, and those potential runs overlap.
Why multiplying windows is not the final probability
A fifty-observation sequence contains forty-five possible starting positions for a six-observation block. Under the same model, the expected number of all-loss windows is 45 × 0.45 to the power 6, approximately 0.3737.
An expected count is not the probability of at least one occurrence. Overlapping windows can occur together, so simply treating all forty-five windows as independent is wrong.
Keep these questions distinct
| Question | Required calculation |
|---|---|
| Next six all lose? | One specified block |
| Any six-loss run in fifty? | Run probability across the sequence |
| Longest run in a sample? | Distribution of maximum run length |
| What happens to balance? | Stake and payoff model as well |
Past losses do not make a win due
Under the independent model, the next loss probability remains q after earlier losses. A long run is not evidence that the next forecast must win.
Real observations may be dependent or conditions may change. That possibility requires a better model, not an automatic assumption that a recovery is imminent.
Use simulations honestly
A simulation can explore the assumptions by generating many sequences and counting runs. Record the probability, sequence length, number of simulations and method. Simulation variability and model error are separate limitations.
Do not use a rare-run calculation to justify a stake-escalation ladder. A finite balance can still be severely affected by a low-probability sequence, and the assumed probability may be wrong.
An exact sequence calculation under the assumed model
For the independent, stable-probability example with loss probability 0.45, the chance of at least one run of six losses increases with the observation horizon. The figures below were calculated with a state recurrence that tracks the current trailing-loss count while excluding paths that have already reached six.
| Total observations | Chance of at least one six-loss run |
|---|---|
| 6 | Approximately 0.8304% |
| 20 | Approximately 7.1356% |
| 50 | Approximately 19.3700% |
| 100 | Approximately 36.2850% |
These are mathematical model outputs, not measured probabilities for a broker or strategy. They assume independent outcomes and the same known loss probability on every observation. The calculation does not establish that a real account meets those assumptions.
How the recurrence accounts for overlap
Start with probability one in the state “zero trailing losses”. At each step, a win moves every surviving state back to zero trailing losses. A loss advances a state from zero to one, one to two and so on. Any path reaching six losses leaves the surviving states.
After the selected number of observations, sum the surviving-state probabilities. One minus that sum is the probability of having encountered a run of at least six. A seven-loss sequence is included in that event without being incorrectly treated as two independent six-loss events.
Expected windows and event probability are different
The earlier expected-window count of approximately 0.3737 over 50 observations is compatible with a 19.37% probability of at least one run. Some sequences contain several overlapping all-loss windows, while others contain none.
For a smaller illustration, the three-result sequence LLL contains two length-two all-loss windows: observations one-to-two and two-to-three. It is still one sequence in which the event “at least one two-loss run” occurs. Counting windows and counting sequences answers different questions.
A run is not the same as drawdown
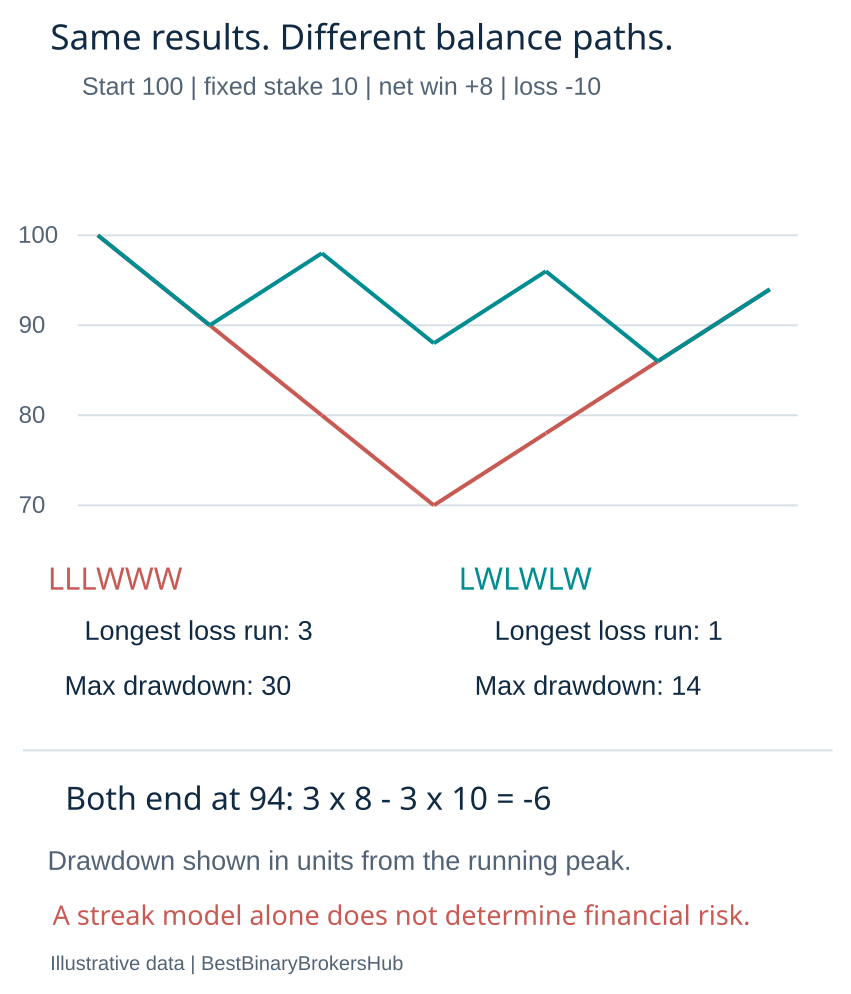
Imagine two fictional result sequences, LLLWWW and LWLWLW, with a fixed 10-unit stake, an 8-unit net winning profit and a full 10-unit loss. Both contain three wins and three losses, so both finish at minus 6 units before other costs. Their longest loss runs are three and one, but their interim balance paths differ.
Stake changes, withdrawals, payout variation and overlapping exposure change the balance analysis further. A run probability cannot determine financial drawdown without those additional assumptions. Do not use a streak table as a reason to escalate stakes after losses.
Estimated probabilities add uncertainty
A historical loss fraction is an estimate, not a known fixed probability. Its reliability depends on sample size, selection and whether the underlying conditions remain comparable. Repeated observations generated by the same move may also be dependent.
NIST’s proportion-confidence-interval guidance provides a framework for uncertainty in a proportion, while its runs-test material discusses investigating non-randomness. Neither reference certifies a trading rule as independent. A failure to detect a pattern is not proof that every modelling assumption is true.
Document a simulation or calculation
- State loss probability, run length and total observation horizon.
- Explain independence and stationarity assumptions.
- Distinguish the event probability from an expected count.
- For simulation, retain the method, number of trials and reproducibility details.
- Report simulation variation separately from uncertainty about the real probability.
- Keep the financial exposure model separate from the outcome sequence.
A calculator result with many decimals can still be misleading when the inputs are unsupported. The most useful report includes both the mathematical answer and the conditions under which it applies.
Frequently asked questions
Is a win due after six losses?
Under the independent model, no. Earlier outcomes do not change the next outcome’s assumed probability.
Does a loss streak prove the strategy is broken?
Not by itself. Compare the complete evidence with a stated model and investigate changed conditions. Do not use a streak alone to prove either failure or reliability.
Can I multiply the number of windows by the block probability?
That gives the expected number of all-loss windows under the model, not generally the probability of at least one run.
Does a rare event justify a recovery ladder?
No. A finite balance can still be badly affected, and the assumed probabilities may be wrong. Our probability tools and research methodology keep assumptions and financial exposure visible.
Sources and research scope
Public-source review: 25 October 2026. Examples are illustrative. Documentary research does not represent funded-account testing. Rules must be checked against the current product, entity and customer location.
Related research
Probability tools · Research methodology · Calculation tools
Risk: Fixed-outcome contracts can lose the entire stake. No chart pattern, calculator or demo result guarantees future returns.