


We may earn a commission through these partner links. Demo funds are virtual; access and country eligibility depend on the platform terms. Disclosure
What this topic means
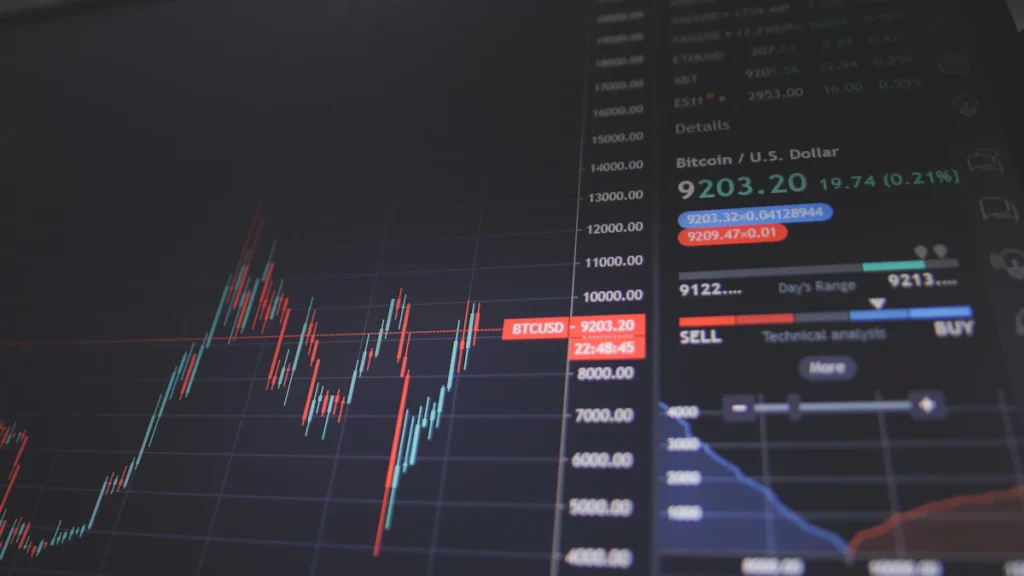
Each completed candle summarises an opening price, highest price, lowest price and closing price for its time interval.
A practical beginner checklist
- A tall body indicates a larger open-to-close movement; a long wick shows movement beyond the body, not necessarily a reversal.
- Consecutive candles can look like a trend, but short horizons are vulnerable to noise, spread and sudden changes in price.
- Do not evaluate a pattern on a still-forming candle as if the close were known. The final body may change before the interval ends.
- Check chart feed, timezone and contract expiry independently; prices shown in different venues or OTC instruments may not match.
- 10:00:00–10:00:59: one M1 candle summarises prices in that interval.
- 10:00:40: a hypothetical 60-second contract is opened.
- 10:01:40: that contract expires, after the first candle ended.
Illustrative clock times only. Check the product’s actual expiry convention, server clock and quote source.
A worked one-minute candle example
Suppose the interval 10:00:00–10:00:59 opens at 100, reaches 102, falls to 99 and closes at 101. The final OHLC is O=100, H=102, L=99, C=101. Its body is 1 price unit, its range is 3 units, and both wicks are 1 unit. These are illustrative prices.
At 10:00:30, the candle is incomplete. Its close and extremes can still change. Recording the final candle after 10:01 and pretending you knew that close at 10:00:30 introduces look-ahead bias.
Why timeframe is not an entry instruction
M1 is a chart aggregation setting. It does not specify when a contract starts, which quote settles it or what its payout will be. For an example of the four prices, read the OHLC candle anatomy guide.
Misunderstandings to avoid
A chart screenshot or an influencer’s selective recording is not independent evidence of a profitable approach. Verify the operator’s legal name, applicable product and jurisdiction directly. Practice interfaces can support learning, but they do not demonstrate real-money performance or confirm withdrawal terms.
- A tall body indicates a larger open-to-close movement; a long wick shows movement beyond the body, not necessarily a reversal.
- Do not evaluate a pattern on a still-forming candle as if the close were known. The final body may change before the interval ends.
Where to go next
Work through the Academy explanations and use the payout calculator to understand the numbers. For any particular provider, review current terms and country restrictions separately.
Frequently asked questions
Does this guide guarantee a result?
No. The material is educational. A binary contract may lose the whole stake, and no part of this explanation predicts future outcomes.
Does an available app prove a product is authorised?
No. The ability to access a service does not itself establish local authorisation. Check the exact entity and product in official sources.
Research sources and further reading
- CFTC & SEC — Binary Options Investor Alert
- SEBI — How to Spot a Scam
- Our Academy
- Country guidance
- Free Payout Calculator
This is general education and does not recommend opening an account, taking a financial position or relying on expected profits.