


We may earn a commission through these partner links. Demo funds are virtual; access and country eligibility depend on the platform terms. Disclosure
OTC backtesting is credible only to the extent that the historical data, timing and payoff model match the contract being studied. A high win rate cannot repair missing entry prices, unknown expiry quotes or decisions made with information that was unavailable at the time.
Research checked 23 October 2026. Numerical examples are illustrative. This guide does not claim access to a complete historical broker OTC tick feed or independently verified strategy results.
What an OTC backtest actually tests
A backtest applies a defined rule to past observations under specified assumptions. It can investigate whether the rule would have produced certain simulated outcomes on that dataset. It does not automatically establish that those orders could have been accepted live, that the same conditions will recur or that account withdrawals will be processed.
Start with the complete instrument identity. An ordinary EUR/USD series is not automatically a substitute for a provider-specific EUR/USD OTC contract. Include the broker, exact symbol, account environment and observation dates. If the data source does not match, describe the work as a study of that source rather than verified performance on another instrument.
Quotex’s Rules of Trading Operations, sections 4.12–4.15, identify its server as the quote reference and describe terminal charts as advisory. That provider-specific distinction is one reason external chart results cannot silently be relabelled as actual broker settlement results.
Minimum data requirements for binary-options backtesting
| Required information | Purpose | If missing |
|---|---|---|
| Full instrument and source | Identify what was tested | Do not claim cross-platform equivalence |
| Timestamp and timezone | Align decision, entry and expiry | Mark timing unresolved |
| Information available at decision | Reproduce the signal | Do not reconstruct it using later bars |
| Entry and expiry quote | Evaluate the price condition | Mark outcome unresolvable where necessary |
| Payout and stake | Calculate the financial result | Use labelled scenarios, not verified profit |
| Ties, fees and adjustments | Represent all outcome types | State the omitted conditions |
Retain the original data separately from cleaned data and the calculated trade log. Document gaps, duplicate timestamps and any corrections. If you replace a missing observation, keep a flag showing the replacement so it cannot later be mistaken for an original quote.
Original hypothetical teaching examples, not provider screenshots, live quotes or verified performance. Assumptions and limits are stated below.
A. Quotes: 100 → 102 → 98 → 99 → 101
Labels show elapsed seconds from 10:00:00; 60s is 10:01:00. Dots are specified synthetic quotes, not an inferred path between observations.
A hypothetical 30-second Call accepted at :15 uses entry 102 and expiry at :45 uses 99. Strict upward condition fails: 99 < 102.
B. Quotes: 100 → 98 → 102 → 101 → 101
Labels show elapsed seconds from 10:00:00; 60s is 10:01:00. Dots are specified synthetic quotes, not an inferred path between observations.
Same :15 entry and :45 expiry times, but quotes are 98 and 101. Strict upward condition is met: 101 > 98.
Both examples have O=100, H=102, L=98, C=101. One completed M1 candle cannot distinguish these sequences or supply these exact intrabar quotes. The 30-second duration is chosen only for this example. If required quotes are unavailable, mark the simulated outcome unresolved; do not invent a smooth reconstruction. Actual settlement also needs the correct feed and contract rules.
Why M1 OHLC candles may not settle a 60-second test
An OHLC candle gives the open, high, low and close for an interval. It does not provide every quote or the exact order of intermediate movements. If a hypothetical entry occurs at 10:00:25 and expiry at 10:00:55, a single 10:00–10:01 candle may contain neither required timestamped price.
Consider two invented intraminute paths with the same open of 100, high of 102, low of 98 and close of 101. One path could be at 101.5 at second 25 and 99.5 at second 55. Another could be at 99.5 and 101.5 at those times. Both fit the candle summary, yet they imply opposite directions between the selected instants.
Drawing a straight line between candle values does not reveal the missing path. Such interpolation is a modelling assumption. It may support an exploratory illustration, but it cannot turn an unobserved expiry quote into a verified historical result.
A test aligned exactly to recorded bar boundaries can answer a narrower bar-to-bar question when those values are available. It still needs an explicit execution assumption; a candle close is not evidence that a broker accepted an order at that same price and instant.
Can TradingView backtest an OTC binary-options strategy?
TradingView’s official strategy documentation explains that its broker emulator simulates fills using available chart data and makes assumptions about historical intrabar movement. Its documentation also covers future-data leakage, selection bias and overfitting. A strategy report therefore needs its source and simulation settings interpreted.
A conventional long/short strategy’s profit calculation is not automatically a fixed-expiry binary payoff. A binary test must explicitly model direction at expiry, accepted net payout, full or partial loss, equality treatment and any other contract outcomes. Do not present a conventional position backtest as binary-options profitability simply because the entry arrows match.
Look-ahead bias: when the answers enter the signal
Suppose your rule enters during a candle because its final close is above resistance. The final close was unavailable before that candle finished. Using it to justify an earlier entry borrows information from the future. The correct decision time must be after the required information becomes available, with execution modelled separately.
The same issue arises when a swing high needs later candles for confirmation. A level can be useful once confirmed, but plotting it retrospectively on the original pivot does not mean it was known there. Record both the location of the pivot and the later time at which the rule could recognize it.
For multi-timeframe rules, preserve what the higher-timeframe candle showed at the lower-timeframe decision time. Substituting the eventual hourly close into every earlier minute can change the simulated decisions. A forward observation log helps expose this mismatch because the later values do not yet exist.
A reproducible OTC strategy testing protocol
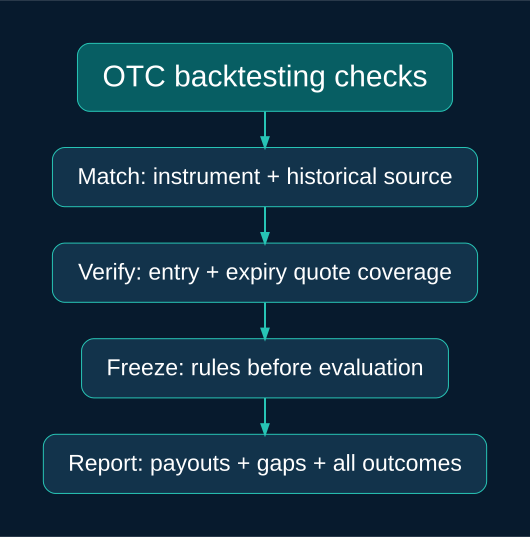
- Write the hypothesis. Define the exact symbol, signal conditions, decision time, direction and expiry.
- Freeze the rules. Record indicator settings, level-confirmation rules and any exclusions before evaluation.
- Audit data coverage. Identify missing quotes and decide in advance how unresolvable cases will be reported.
- Separate development and evaluation. Tune on an earlier segment and assess the frozen version on a later unused segment.
- Log every qualifying event. Include losses, excluded events and reasons, rather than retaining attractive examples only.
- Calculate the specified payoff. Use recorded returns where available and labelled assumptions otherwise.
- Preserve versions. A rule changed after evaluation needs a new evaluation, not a rewritten old result.
A chronological split is useful for showing what was decided before later observations. It is not a guarantee of independence: nearby or overlapping contracts may share much of the same price movement. Explain that dependence instead of treating every entry as wholly separate evidence.
Overfitting and the hidden number of attempts
Imagine testing 30 combinations of indicators and publishing only the combination that performed best. Its result reflects selection from those attempts. Readers need to know that the alternatives existed, including unsuccessful versions. Repeatedly consulting the evaluation set also turns it into development data.
Prefer clearly specified rules that another person can reproduce. Terms such as “strong candle” or “clean resistance” need measurable definitions if they decide entries. For a manual study, save the decision-time screenshot and written reason before revealing the later outcome.
Win rate is not the same as net profit
In an invented equal-stake sample, 60 wins and 40 full losses produce +8 units at an 80% net profit payout: 60 × 0.8 − 40. At a 60% payout, the same outcomes produce −4 units. The price predictions are unchanged; the financial result changes sign.
If historical payouts are unavailable, report both scenarios as assumptions. Do not apply today’s highest displayed return to every past winner. Where payouts vary, calculate each contract individually, retaining ties, refunds and adjustments as their own outcomes.
Also distinguish cumulative net profit from the path taken to reach it. A final positive total can conceal a large interim drawdown or a concentrated winning session. Report the sequence and stake policy so the result can be interpreted.
What to publish with a backtest result
Include the sample period, instrument, source, rule version, number of qualifying events, missing-data count, execution assumptions, payout treatment and net result. Separate development performance from evaluation performance. State whether the records are simulations, demo transactions or accepted live contracts.
For a sample of 20 wins out of 25 observations, “80% observed win rate” describes that sample only. It does not establish a stable 80% future probability. Sample size, selection and overlapping observations all affect how much can be concluded.
Frequently asked questions
Can screenshots alone verify an OTC strategy?
Selected screenshots can illustrate patterns but rarely establish complete performance. A defined sampling method and a full event log are needed to understand what was omitted.
Does tick data solve every backtesting problem?
No. You still need matching contract specifications, timing, payout information and realistic execution assumptions. More detailed data cannot repair a rule that uses future information.
Is forward testing proof of live profitability?
A timestamped forward log can improve evidence about decision-time behaviour. Demo or simulated results still do not establish live execution, withdrawals or future returns.
Sources and related reading
The linked official documentation supports the platform and simulator distinctions. The examples and testing workflow are educational analysis. Read our chart comparison guide, OTC vs real-market comparison, demo practice guide and methodology.
Risk: Binary options can lose the full stake. A backtest investigates historical assumptions; it does not guarantee future performance.