


We may earn a commission through these partner links. Demo funds are virtual; access and country eligibility depend on the platform terms. Disclosure
The stochastic oscillator compares a closing price with a recent high-low range. A reading near an extreme describes relative position in that window, not a guaranteed reversal.
Understand the core calculation
A basic %K value is 100 × (close − lowest low) ÷ (highest high − lowest low) over a chosen lookback. Implementations may smooth %K and create a %D signal line.
State the lookback and smoothing settings. A ‘14,3,3’ configuration is not fully explained by saying stochastic alone, and a zero-range window needs defined handling.
An original example
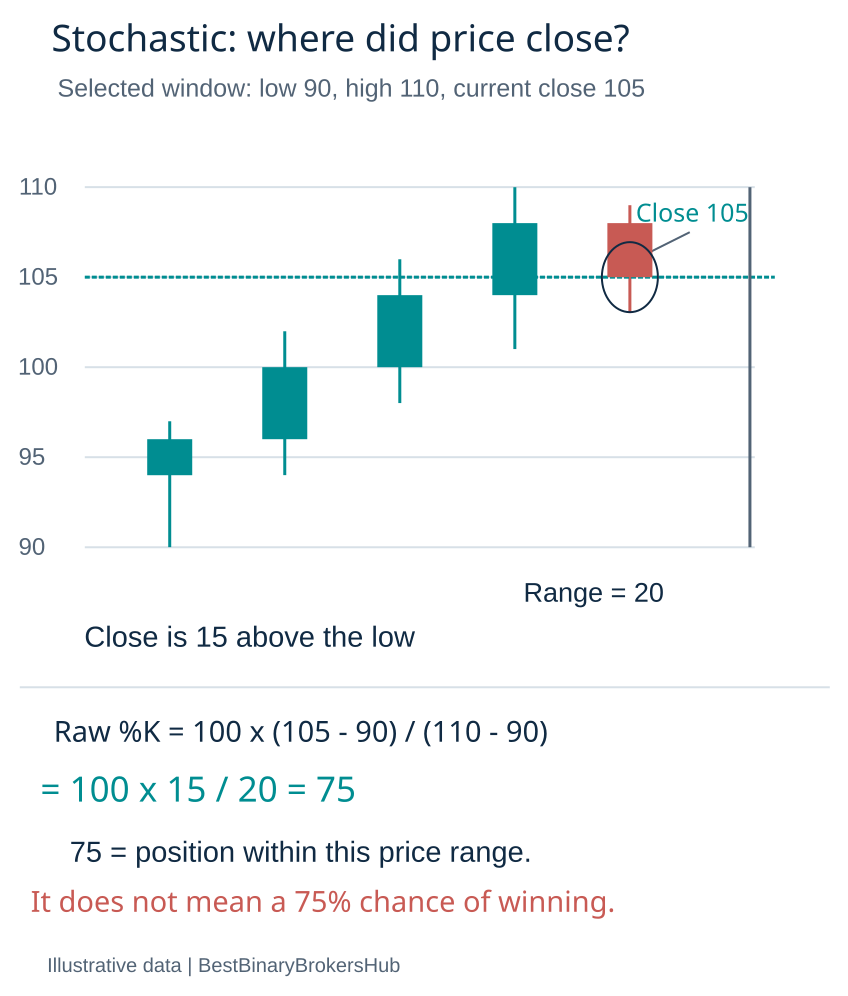
If the selected window’s lowest low is 90, highest high is 110 and current close is 105, the unsmoothed range-position value is 100 × 15 ÷ 20 = 75.
This does not imply a 75% chance of an upward contract winning. It means the close is three quarters of the way from that window’s low to high.
Extreme does not mean immediately wrong
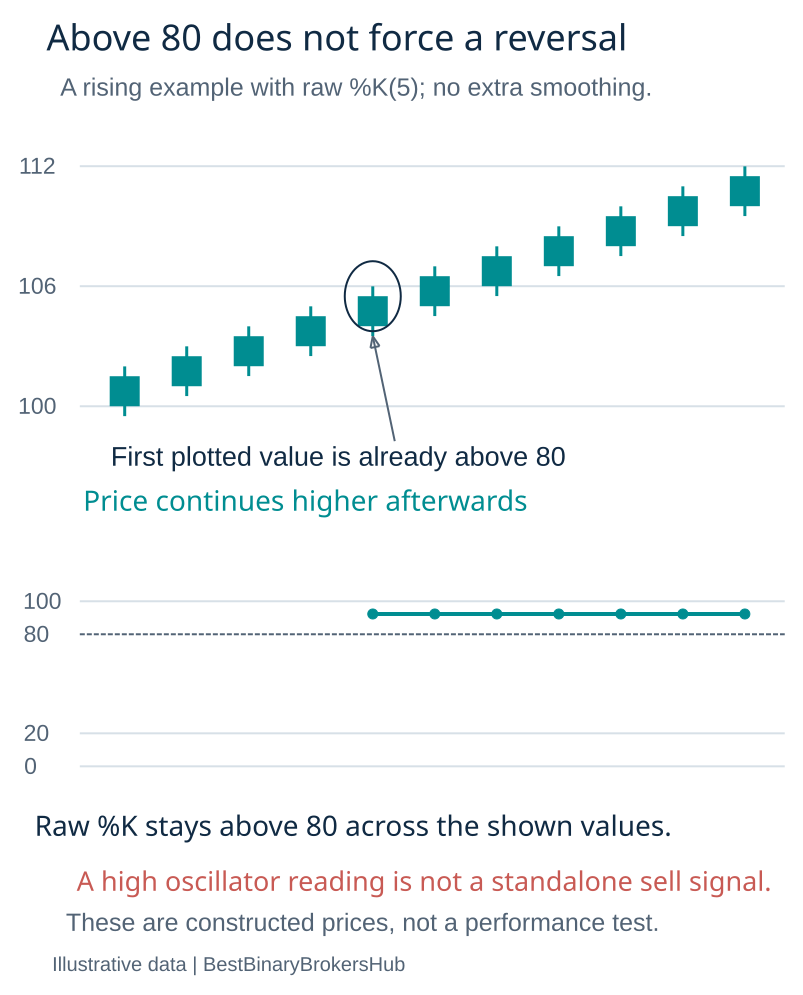
A strong rise can keep closes near the top of their recent range. A rule that automatically predicts down whenever the oscillator is high needs evidence, not just a familiar threshold label.
The same applies at the lower extreme. A low reading can persist while price continues downward.
Distinguish related indicators
| Indicator | Input being positioned |
|---|---|
| Price stochastic | Price close relative to price range |
| Stochastic RSI | RSI relative to its own range |
| RSI | Smoothed price gains and losses |
The names are related, but their numbers are not interchangeable. Record the exact tool and formula used.
Make crossing rules reproducible
Specify whether an entry condition uses a completed-bar crossing of a level, a crossing between lines or an intrabar observation. These can produce different event counts.
If the signal disappears before close, do not use the final historical chart to claim that it was never present in a live experiment. Preserve the decision-time state.
Evaluate the actual horizon
A later reversal can occur after a short-expiry contract has already lost. Measure entry, expiry and payoff, not merely whether the chart eventually moved in the expected direction.
Use a separate evaluation sample and retain failures. An oscillator configuration that looks convincing after repeated adjustments is not independent proof of an edge.
Separate raw range position from smoothed lines
The unsmoothed calculation and the displayed %K line can differ when smoothing is applied. %D then averages the chosen %K sequence under its own setting. Record the named input fields rather than assuming that three numbers are interpreted in the same order by every platform.
In a fictional example, three successive raw values are 60, 75 and 90. Their three-value simple average is 75. That smoothed value is different from the latest raw reading of 90. This arithmetic illustrates why two apparently similar configurations can produce different crossings without either being incorrectly calculated.
Make the event definition explicit
| Possible condition | Definition that must be recorded |
|---|---|
| %K above a level | Current state or a new crossing? |
| %K crosses %D | Previous and current line relationship |
| Return from an extreme | Threshold, direction and completed-bar requirement |
| Intrabar signal | Observation time and how disappearing signals are retained |
| Higher-timeframe condition | Which completed or developing source bar is used |
A rule that checks “above 80” on every bar can count many consecutive events during one extended rise. A rule counting only the first crossing has a different sample. Do not present their accuracy figures as directly comparable without explaining the event definition.
A high reading can persist
Suppose a fictional rising sequence keeps closing near each lookback window’s high. The oscillator can remain elevated as both highs and lows advance. A down prediction based solely on the label “overbought” can fail repeatedly before any reversal occurs.
The inverse is possible in a falling sequence. A low reading describes the close’s position in its recent range, not proof of a price floor. If a study adds trend or support/resistance conditions, define those conditions precisely rather than retrospectively deciding which examples looked strong.
Handle special cases honestly
When the highest high equals the lowest low, the raw formula has a zero denominator. Inspect how the specific implementation handles that case and retain missing or substituted values explicitly. Do not invent a 50 reading and attribute it to the platform without checking its actual behaviour.
Changing lookback boundaries can also move the oscillator even when the latest close changes little. An old extreme leaving the window changes the reference range. Preserve the source bars if reconstructing a result rather than inferring the calculation only from the final line image.
Stochastic RSI is a different calculation
TradingView’s separate Stochastic RSI description applies the range-position calculation to RSI values. That is different from locating a price close within a price range. Some displays use a 0-to-1 scale and others express the same kind of ratio on a 0-to-100 scale; identify the particular implementation.
A Stochastic RSI value near 0.8 should not be compared numerically with a price stochastic setting without understanding the input and scale. Neither value is a calibrated probability that the next contract will win.
Design a fair evaluation
- Fix the exact indicator, input fields and source timeframe.
- Define one event and the information available when it occurs.
- Record the accepted entry, holding horizon and exit or expiry rule.
- Retain every qualifying result, including repeated failures.
- Calculate net outcomes using actual documented payoff assumptions.
- Keep tuning observations separate from later evaluation data.
A chart can reverse eventually while a short-expiry contract loses first. That is why an “eventually correct” screenshot does not establish the result of the specified rule. If several overlapping events arise from the same move, identify their dependence rather than presenting them as independent proof.
Frequently asked questions
Does a reading of 75 mean 75% winning probability?
No. In the basic example it represents position within a recent range. Outcome probability requires a separate supported model and evaluation.
Does a crossover guarantee an immediate reversal?
No. It identifies a relationship between calculated lines, not a guaranteed future path or contract result.
Why did a signal disappear before close?
The developing close and range can change during the bar. Preserve the live observation and distinguish it from a completed-bar rule.
Which settings are best?
This guide makes no universal claim. Settings define a calculation; their usefulness depends on the actual data and a properly evaluated objective. See our indicator academy and research methodology.
Sources and research scope
Public-source review: 25 October 2026. Examples are illustrative. Documentary research does not represent funded-account testing. Rules must be checked against the current product, entity and customer location.
Related research
Indicator academy · Research methodology · Calculation tools
Risk: Fixed-outcome contracts can lose the entire stake. No chart pattern, calculator or demo result guarantees future returns.