


We may earn a commission through these partner links. Demo funds are virtual; access and country eligibility depend on the platform terms. Disclosure
An observed win rate is uncertain even when every observation is recorded correctly. A confidence interval can describe sampling uncertainty under a model, but cannot repair a biased or changing dataset.
Begin with the assumptions
A standard binomial-proportion interval assumes a suitable sequence of binary observations and a stable underlying success probability. Strong dependence, selective reporting or changing rules can make that model inappropriate.
NIST presents Wilson-style intervals for proportions. The formula is a statistical method, not evidence that a trading dataset satisfies its assumptions.
An original numerical example
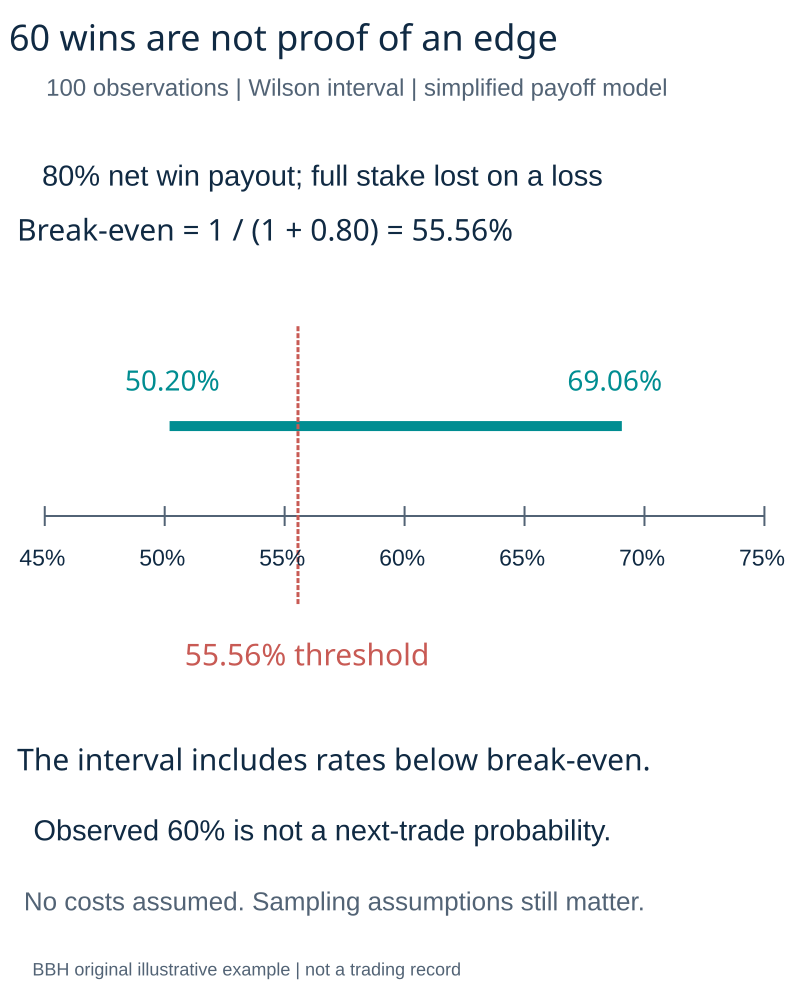
Suppose a predefined demo rule produces sixty wins and forty losses. The observed rate is 0.60. Using z = 1.96 in the two-sided Wilson formula gives an interval of approximately 50.20% to 69.06%.
This is a model-based calculation for that illustrative dataset. It is not a guarantee that the next contract has a probability somewhere in that range.
How to reproduce the calculation
Let n be the count and p-hat the observed rate. Compute denominator D = 1 + z²/n. The centre is (p-hat + z²/(2n)) ÷ D.
The half-width is z × square root of [p-hat(1 − p-hat)/n + z²/(4n²)] ÷ D. Subtract and add it to the centre. Retain full precision until the final display.
Compare uncertainty with the payoff threshold cautiously
At an illustrative 80% profit payout with full-stake losses and no costs, the theoretical break-even threshold is approximately 55.56%. The example interval extends below that threshold.
The observed 60% rate therefore should not be presented as conclusive proof of a profitable process. Even an interval entirely above a threshold would still require valid sampling, payoff assumptions and protection against repeated-testing bias.
What the interval does not cover
| Problem | Why the interval is insufficient |
|---|---|
| Deleted losses | Input is biased |
| Many tested rules | Winner selection changes inference |
| Correlated entries | Effective information differs |
| Changing payouts | Win probability is not the whole payoff |
| Provider failure | Outside this price-outcome model |
Report the method alongside the number
State the counts, observation rule, period, account mode, interval method and assumptions. Keep refunds and exclusions explicit.
A longer sample can reduce some sampling uncertainty while leaving systematic bias unchanged. Use the interval to make claims more cautious and testable, not to manufacture a scientific-looking guarantee.
The same observed rate can have different uncertainty
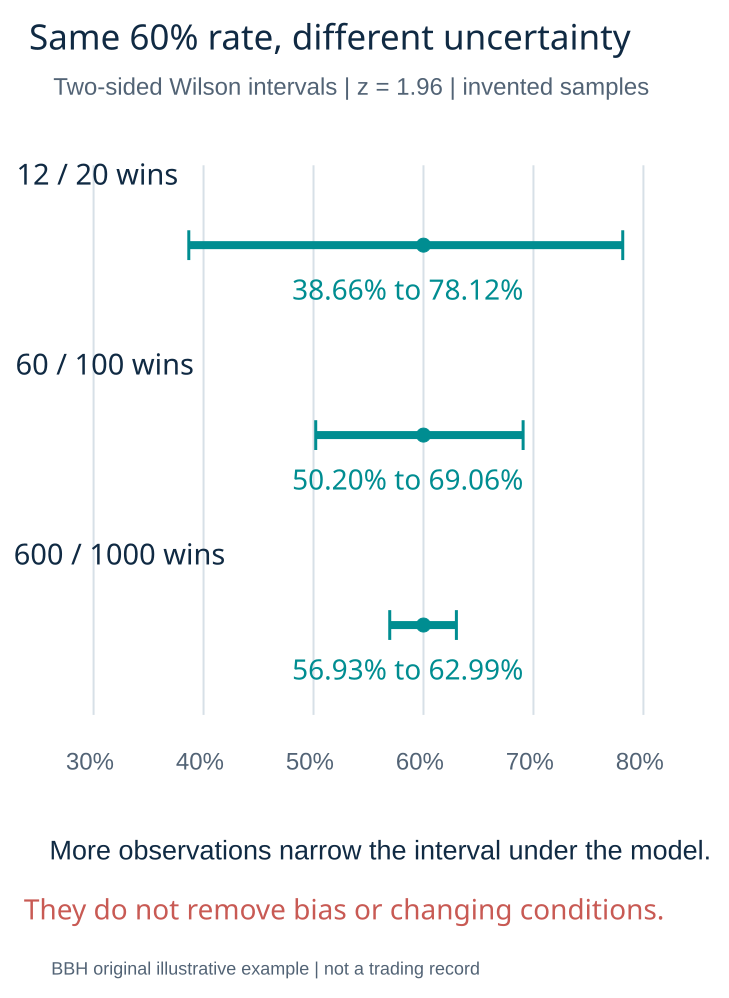
The examples below all report a 60% observed success rate. Applying the same two-sided Wilson calculation with z = 1.96 gives different interval widths because the counts differ. Values are rounded only for display.
| Illustrative results | Observed rate | Approximate Wilson interval |
|---|---|---|
| 12 wins out of 20 | 60% | 38.66% to 78.12% |
| 60 wins out of 100 | 60% | 50.20% to 69.06% |
| 600 wins out of 1,000 | 60% | 56.93% to 62.99% |
These are original calculations for invented datasets, not performance records. The narrower interval in the last row assumes the additional observations provide suitable information under the model. Adding duplicated or strongly dependent observations does not automatically provide the same benefit.
What 95% confidence means here
Under the model, the interval procedure is intended to have approximately the stated coverage over repeated samples. It should not be described as a 95% probability that the next trade wins, or as a 95% guarantee that future performance will remain between the displayed endpoints.
A fixed underlying success probability is the quantity the model seeks to estimate. The interval comes from the sample and method. If the rule or market process changes, that original model may no longer describe the new observations.
Translate the observed rate into the right payoff question
With an illustrative 80% net winning payout and full-stake losses, a constant one-unit stake has model expected net result 0.8p minus (1 − p), or 1.8p − 1 units per trial. At an assumed p of 0.60, that expression gives 0.08 units. It is conditional arithmetic, not evidence that p really equals 0.60.
The 60-out-of-100 interval extends below the simplified break-even rate of 1 ÷ 1.8. The 600-out-of-1,000 interval does not, but even that comparison cannot establish a live edge without valid observations, stable payoffs, costs and protection against selection bias. A win-rate interval is only one part of the analysis.
Define ties, refunds and exclusions before counting
If an experiment records wins, losses and refunds, state which outcomes enter the binary count and why. Report the complete original counts alongside the chosen denominator. Removing inconvenient outcomes after reviewing results can bias the rate.
If outcomes have different payoff structures, a single win proportion may omit important economic information. Retain stake, payoff, fee and net result for each observation. A rule can have a high observed win rate while losing money under a sufficiently uneven payoff model.
Repeated checking changes the inference
Calculating an interval after every new observation and stopping when the lower endpoint first exceeds a target is a different procedure from analysing a preselected fixed sample. A nominal fixed-sample interval should not be presented as though it automatically validates that stopping strategy.
Likewise, choosing the best of many indicator settings after testing all of them on the same history introduces selection. Preserve the tested variants and use a suitable separate evaluation design. A statistical formula cannot remove hindsight from the input sample.
A useful reporting checklist
- State the exact rule, version, dataset and account mode.
- Report wins, losses, refunds and exclusions.
- Specify the interval method, confidence level and rounding.
- Explain assumptions about independence and stability.
- Disclose tuning, repeated checks and stopping decisions.
- Present payoff and cost evidence separately from the win rate.
NIST supplies a method for proportion uncertainty, not a certificate for any particular trading record. Keep that distinction visible when explaining the source and the calculation.
Frequently asked questions
Does 60 wins out of 100 prove a true 60% rate?
No. It is the observed fraction in that sample. Sampling uncertainty and model limitations remain.
Can a larger sample repair deleted losses?
No. More biased observations do not remove the bias. Recover the complete records and disclose missing data.
Is the interval a forecast for the next contract?
No. It estimates a model parameter under stated assumptions, not an individual outcome.
Does an interval above break-even guarantee profit?
No. The payoff model, validity of the sample, future stability and operational risks remain relevant. See our research methodology and probability tools for transparent assumptions.
Sources and research scope
Public-source review: 25 October 2026. Examples are illustrative. Documentary research does not represent funded-account testing. Rules must be checked against the current product, entity and customer location.
Related research
Probability calculation tools · Research methodology · Calculation tools
Risk: Fixed-outcome contracts can lose the entire stake. No chart pattern, calculator or demo result guarantees future returns.