


We may earn a commission through these partner links. Demo funds are virtual; access and country eligibility depend on the platform terms. Disclosure
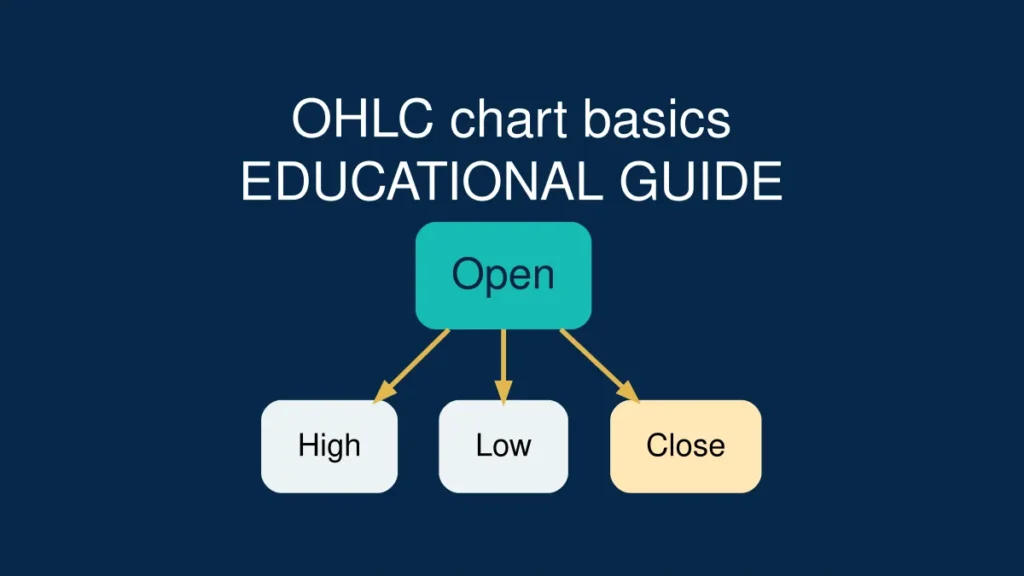
OHLC is the foundation of candlestick reading: Open, High, Low and Close show what happened during a chosen timeframe. Beginners often misunderstand wicks, colours and running candles, then treat them as certain predictions. This guide explains each part with numbers and practical exercises.
Educational chart guide, source-checked 20 October 2026 against CME Group chart types. No trading signal or guaranteed outcome is implied.
What this guide adds: The OHLC basics article introduces the four prices; this companion guide concentrates on common mistakes: reading an unfinished candle as final, confusing the chosen chart interval with contract expiry, and comparing instruments from different feeds. See also one-minute chart limitations.
OHLC means four prices, not four predictions
Live candle versus closed candle: On a still-forming bar, the final high, low and close are not yet settled; what appears on the chart can change until the interval ends. This distinction is documented in TradingView’s explanation of real-time bars. Treat live OHLC readings as provisional, not confirmed signals.
OHLC stands for Open, High, Low and Close. These values describe one completed interval of a price series. Open is the first recorded price, high is the highest price observed within that interval, low is the lowest and close is the final recorded price before the next interval begins. None of those four numbers determines what happens next. Reading an OHLC candle is a useful literacy skill because it helps you understand what a chart displays without relying on somebody else’s entry arrow, colour-coded alert or dramatic trading video. The first task is to identify the time interval and data source; only then can the numbers be interpreted correctly.
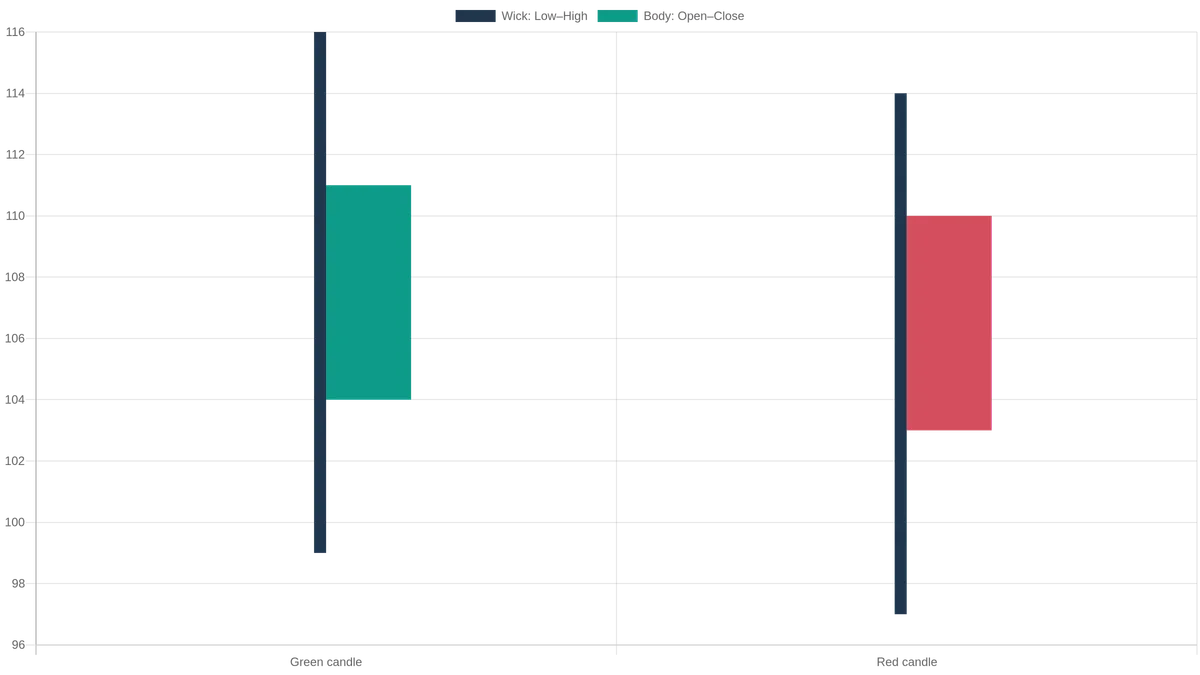
Open 104 · Close 111
High 116 · Low 99
Body: 104–111 = 7 units
Upper wick: 111–116 = 5 units
Lower wick: 99–104 = 5 units
Full range: 99–116 = 17 units
Hypothetical completed-candle values; not real price data or a next-candle prediction. The red example closes below its own open; colour alone does not decide a contract outcome.
A single candle with real numbers
Imagine a hypothetical five-minute candle with an open of 104, a high of 116, a low of 99 and a close of 111. The price travelled within a seventeen-unit high-to-low range, and it ended seven units above the open. A typical candlestick draws the body between 104 and 111 and thin wicks toward 116 and 99. Because the close exceeded the open, the body is usually green or another configured bullish colour. This example does not mean price climbed smoothly from 104 to 111: OHLC contains no complete record of the order or timing of every move inside the interval. It is a summary, not a video of the journey.
Open: where an interval begins
The opening price is tied to the chosen candle interval, not necessarily to the opening of a stock exchange or a trading day. On a continuous market’s one-minute chart, every minute can produce its own open. On a daily chart, each session has a different open, and holidays or market closures can create gaps between intervals. Beginners sometimes compare the open of a one-minute candle with the opening price of an entire trading day and draw an incorrect conclusion. Always look at the timeframe indicator displayed in the chart toolbar before interpreting a number. The exact recorded price also depends on which price feed the platform uses.
High and low: range, not the direction of the next trade
The high and low are the extremes reached during the interval. A large high-to-low range can indicate that the observed price moved through a wider range than during a quiet candle. But it does not tell you which side won the next interval, whether every participant was able to trade at the extreme or whether the movement reflects a reliable trend. Two candles can share the same open and close while having very different wicks. This matters when evaluating social media claims that a long upper wick is a guaranteed bearish signal. The wick describes historical movement; it does not prove a future reversal.
Close: useful context without certainty
Close is the final price recorded for the interval according to the chart feed. If a five-minute candle closes above its open, the candle body usually appears bullish. If it closes below, it appears bearish. That comparison is objective. A conclusion such as “buyers are guaranteed to push the next candle higher” is not objective. Candles can close near their high or low and still be followed by opposite movements. When discussing charts, say exactly what is observable: “the close was near the high” is more accurate than “buy pressure means a winning CALL.” The latter adds an unverified forecast and contract-dependent assumption.
Candle body: what its size actually measures
The body spans the opening and closing prices. A long body records a larger net change between those two values; a small body records a smaller net change. A tiny body can appear even when price moved sharply during the interval and later returned close to the open. That is why body size must be read alongside the wicks and the interval’s total range. A short body does not automatically mean the market is safe or that the next move must be large. Consider the instrument, timeframe and feed before comparing bodies: a one-unit body on one asset may represent a different relative movement from a one-unit body on another asset.
Upper and lower wicks: common reading mistakes
An upper wick stretches from the top of the body toward the high; a lower wick extends from the bottom of the body toward the low. A wick can reflect prices reached and then left behind before the interval ended. It cannot by itself reveal why the price changed, how much volume traded there or whether the next candle will move away from that level. A common mistake is to treat every upper wick as a short signal and every lower wick as a long signal. Another is to ignore where the candle sits within the wider price range. A wick beside a major high, in the middle of a range and during unusual volatility can have very different contexts.
The running candle is not the finished candle
While an interval is still open, its high may rise, its low may fall and its closing value is provisional. A moving candle that looks bullish forty seconds into a minute can finish bearish after the final twenty seconds. Screenshot-based prediction videos sometimes point to a pattern that was not fully formed at the moment of the alleged decision. For objective chart education, wait for the candle to close before labelling its final shape. Keep the timestamp visible when you save examples. This does not make a signal profitable, but it prevents a basic error: describing information as known before it actually existed.
Timeframes: one minute, five minutes and one hour
Each timeframe compresses a different amount of market activity into a single candle. Twelve consecutive five-minute candles cover an hour; one hour-long candle summarises the same span at a much coarser level, assuming a consistent data feed and session. A one-minute reversal-shaped candle may simply be a brief pause inside a strong movement visible on an hourly chart. A daily candle may include multiple small swings that disappear in the larger body. When comparing a candlestick pattern across timeframes, define the timeframe first. Do not assume that a pattern name has identical meaning or predictive reliability on every chart resolution.
A simple comparison: two candles, same close
Imagine Candle A opens at 104, rises to 116, falls to 99 and closes at 111. Candle B also opens at 104 and closes at 111, but its high is only 112 and its low is 103. Both have a bullish body seven units tall. Their ranges are seventeen units and nine units, respectively. The different wick structures tell you that the observed intervals travelled through different price extremes. OHLC alone still cannot reconstruct every tick or identify the reason for that difference. This exercise helps readers move beyond the simplistic “green equals buy” belief and look at what the data genuinely contains.
Where support and resistance fit into the picture
Support and resistance are zones that a researcher may draw from repeated reactions around earlier price levels. They are not single-pixel guarantees that price will reverse. A candle with an upper wick near prior highs may be described as a test of a resistance area, but its meaning depends on repeated observations, body closes, trend context and the possibility of a breakout. A wick that moves briefly beyond a line is not necessarily a confirmed break. If a level is crossed, chart readers commonly ask whether later candles accept the price beyond the zone and whether a retest holds. None of those questions replaces evidence about the actual performance of a strategy.
Why chart colour is a setting, not a universal rule
Most educational charts display candles green when close exceeds open and red when close is below open. Software can change the colours, however, and some platforms invert or customise themes. Do not rely entirely on colour; check the actual OHLC values. This is especially important for readers using screenshots from other apps or accessible high-contrast themes. A blue body could be bullish in one interface and bearish in another. When teaching a pattern or documenting a practice exercise, label open and close explicitly so the explanation still works for readers with colour-vision differences or monochrome prints.
OHLC versus line and bar charts
A line chart often connects selected closing prices and gives a clean view of broad movement, but it usually hides the high and low reached during each interval. An OHLC bar chart displays the same four price values with a vertical range line and small horizontal marks for open and close. A candlestick displays the four values using a thicker body and upper/lower shadows. All three are visualisations of price data rather than separate sources of guaranteed signals. CME Group’s educational material describes the difference between these chart types. A beginner can compare them to see how changing the drawing method changes appearance without changing the underlying values.
What a doji-like candle does and does not say
A candle with an opening price close to its closing price may look like a thin body or cross. Some educational guides call this a doji or indecision-like candle. The label can be useful as a visual description, but it does not mean the market has stopped or that a breakout is guaranteed. A large high-low range and almost equal open-close values show that price visited different levels before finishing near its start. A tiny range and tiny body describe a much quieter interval. Calling both candles a profitable trading signal would ignore those differences. Describe the actual range and location rather than letting a pattern nickname make the decision.
Price sources, OTC charts and matching screenshots
Two charts carrying the same-looking asset label are not necessarily derived from the same price series. OTC instruments, simulated or proprietary quotes, broker-specific feeds and exchange-traded markets may use different reference prices or trading hours. Differences may also arise from the display timezone, session boundaries or whether a feed shows bids, asks or another reference. A reader comparing results should record the provider, instrument identifier, interval, timezone and exact timestamp. A candle that looks like one shape on one screen may look different on another without proving either chart’s future forecast. Never copy a signal from one feed to another merely because the label looks familiar.
How OHLC differs from a binary contract’s settlement
A candlestick is a chart summary. A fixed-outcome binary contract is a financial agreement with particular strike, expiry and settlement rules. Even correctly reading the last candle does not prove that a binary prediction will pay out. Some contracts depend on whether a named reference price meets a condition at a specific time. They may carry a full-stake loss if that condition is not satisfied. The US investor protection resources describe these all-or-nothing characteristics and complaints associated with some internet-based platforms. Learn the distinction before treating chart literacy as evidence that a financial product is safe, legally authorised or suitable.
A five-step practice worksheet
Choose a public educational chart source and one price series. Record the instrument, timezone and candle interval. For each of ten completed candles, write Open, High, Low and Close in a table. Then compute the body change as Close minus Open and the full range as High minus Low. Mark a candle bullish or bearish from the open-close relationship, not merely from a configured colour. Finally, compare any wick interpretation with the following candle without claiming a small sample proves a pattern works. This activity requires no real-money deposit and provides a solid foundation for understanding chart screenshots, inconsistent broker claims and overconfident “next candle” videos.
What belongs in an honest beginner explanation
An educational OHLC guide should show one numerical example, distinguish a completed candle from a running candle, explain the timeframe and name the data source. It should avoid claims of certain entry points, guaranteed success percentages or fixed daily returns. Where the guide discusses platform-specific chart behaviour, link to current technical documentation rather than recycling old screenshots. If it discusses a binary product, include the financial risk and relevant regulator warning. Readers searching for a candle explanation deserve enough information to recognise bad claims even if they never open a trading account. That is a better outcome than encouraging trades based on a single coloured shape.
OHLC values: numerical comparison
| Candle | Open | High | Low | Close | Body change | Full range |
|---|---|---|---|---|---|---|
| A | 104 | 116 | 99 | 111 | +7 | 17 |
| B | 104 | 112 | 103 | 111 | +7 | 9 |
| C | 110 | 114 | 97 | 103 | −7 | 17 |
These are invented numbers for teaching OHLC definitions. They are not broker quotes.
Frequently asked questions
What does OHLC stand for?
Open, High, Low and Close, the four prices summarising an interval.
Is a green candle proof that the next candle will rise?
No. A green candle tells you the completed interval closed above its open; the next interval remains uncertain.
Can a wick reach beyond the candle body?
Yes. Wicks show the high and low outside the open-close body where those extremes occurred.
Should I read an unfinished candle as a final pattern?
No. Its high, low and final close can change before the interval ends.
Does the same instrument always have identical candles on two apps?
Not necessarily. Feeds, reference prices, session definitions and chart timezones can differ.
Can OHLC information guarantee a winning binary contract?
No. Contract expiry, strike, settlement and financial risk are separate from recognising historical price values.
Verified reading and related topics
- CME Group: Chart Types — Candlestick, Line and Bar — primary educational reference for body, wicks and OHLC.
- CME Group: Technical Analysis Basics — chart and pattern context.
- Investor.gov: Binary Options Fraud — financial and platform risks, which charts cannot remove.
- Our Academy and Payout Calculators for further education.
Conclusion: Start with exact OHLC numbers and a completed timeframe, not a trading prediction based on colour alone. Knowing what a candle describes is valuable; it is not evidence of a reliable strategy or of a safe broker.